Pi Network Price Forecast: PI reclaims 50-day EMA as overhead resistance looms near $0.10
- Pi Network hovers above $0.0950 on Friday after four consecutive days of gains totaling over 5%.
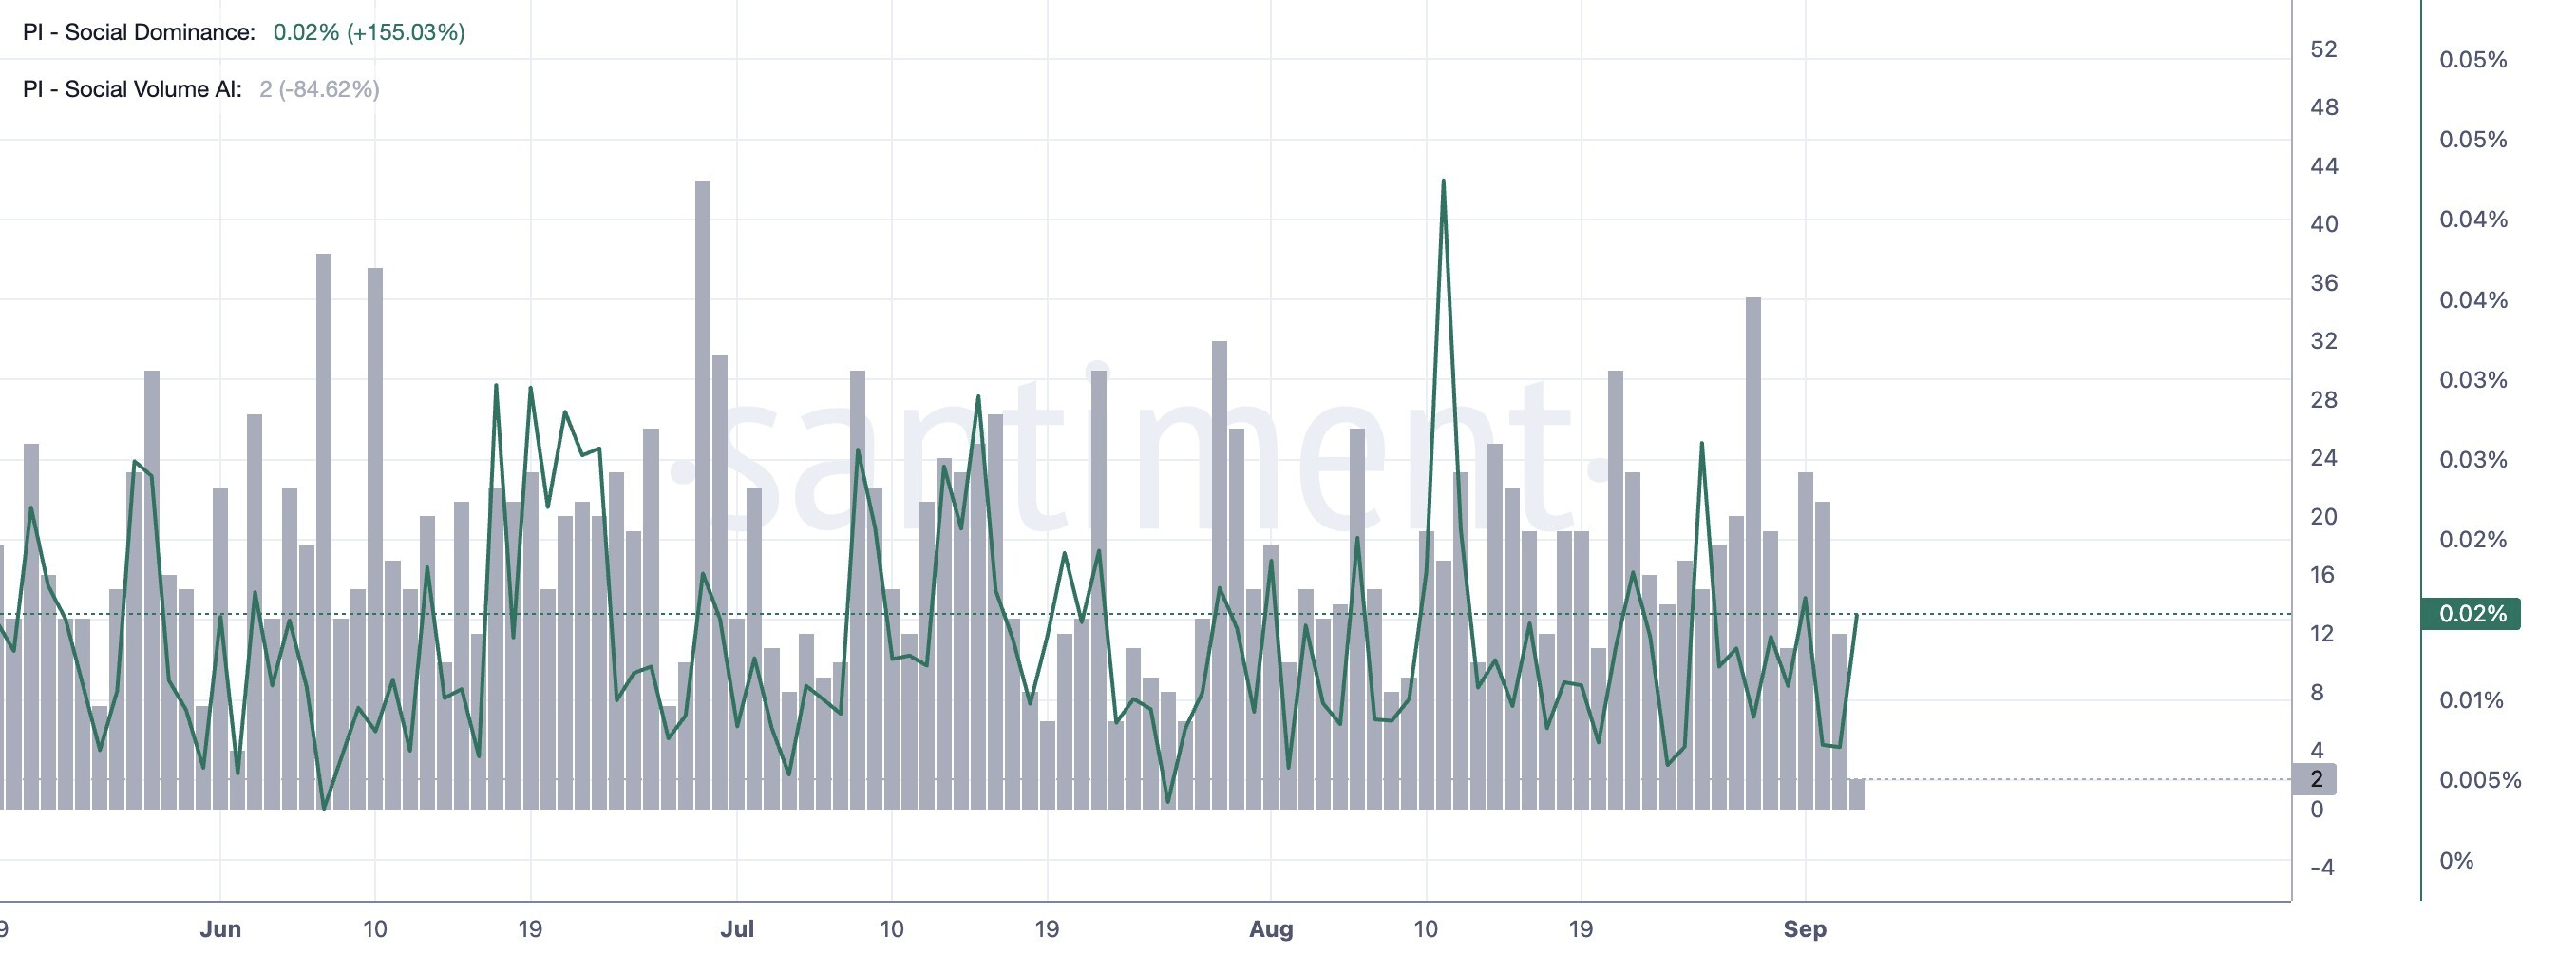
- Santiment data shows PI social dominance on the rise amid broader market risk-on sentiment, signaling upside potential.
- The technical outlook for PI is bullish as price reclaims the 50-day EMA at $0.9388, with next resistance around $0.10.

Pi Network (PI) edges lower on Friday, holding steady above its 50-day Exponential Moving Average (EMA) around $0.09388 after four consecutive days of recovery. PI token gains mild social dominance amid improving risk appetite in the broader crypto market. The technical outlook for PI indicates a mild bullish bias as the price holds above the 50-day Exponential Moving Average (EMA) at $0.9338, with bulls eyeing the $0.10 threshold.
PI token’s social dominance recovers
Pi Network shows upside potential amid rising social interest. Santiment data shows the PI social dominance rising to 0.020%, from 0.00705% the previous day, suggesting an increased share of Pi Network-related discussions in the crypto media.
At the same time, the broader crypto market maintains a bullish sentiment amid reduced chances of a rate hike at the US Federal Reserve’s September meeting, as previously reported by FXStreet.
Technical outlook: Will PI extend its recovery?
Pi Network trades around $0.0952 at press time on Friday, sustaining its 5% gains after four consecutive days of recovery. The PI token holds a capped bias as it trades below the 100-day and 200-day EMAs at $0.1074 and $0.1459, respectively, despite reclaiming the short-term support at the 50-day EMA around $0.0938.
The Relative Strength Index (14) hovers near 59, indicating firm but not extreme bullish momentum.
From a technical perspective, the $0.1000 psychological threshold, which aligns with the 50% retracement of the $0.1341-$0.0703 downswing at $0.1022, acts as a crucial resistance cluster. A confirmed breakout above this zone could target the 100-day EMA at $ 0.1074, followed by the 78.6% Fibonacci retracement at $0.1204.
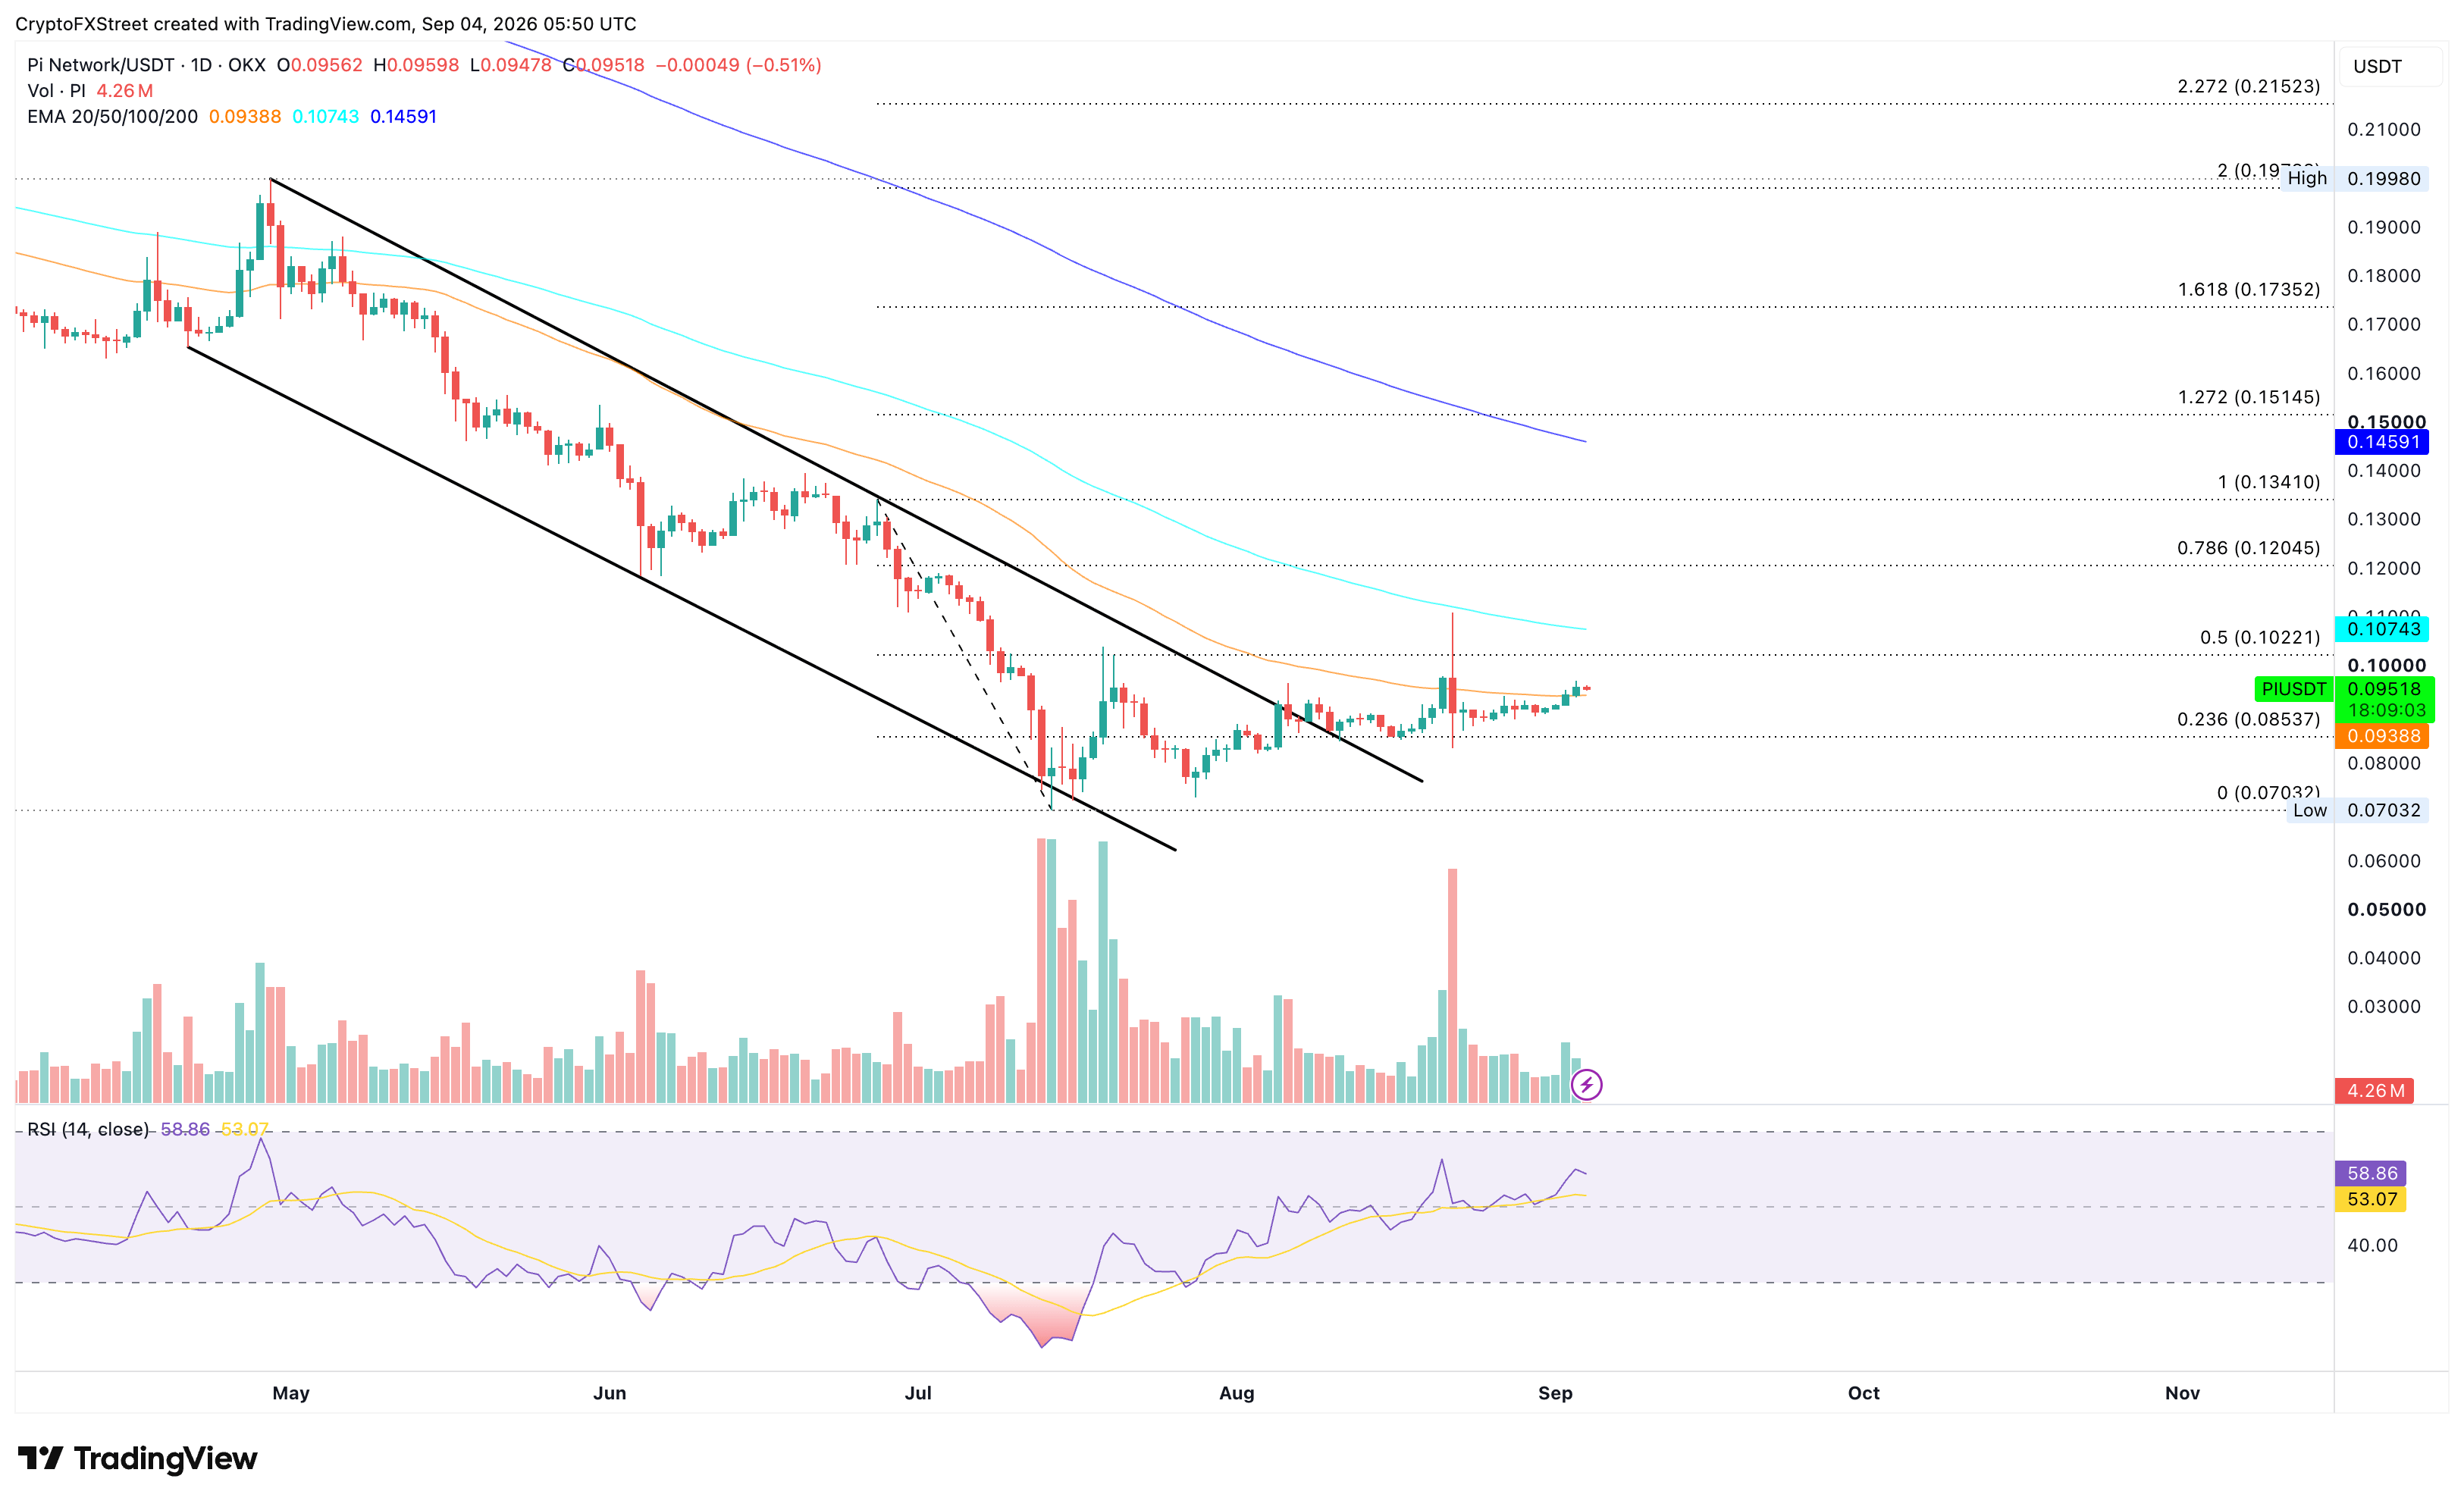
On the downside, initial support is seen at the 50-day EMA at $0.0938, followed by the 23.6% Fibonacci retracement level at $0.0853. A daily close below this level would expose the $0.0703 record low and keep the broader bearish structure intact.
(The technical analysis of this story was written with the help of an AI tool. Know more.)
Author

Vishal Dixit
FXStreet
Vishal Dixit holds a B.Sc. in Chemistry from Wilson College but found his true calling in the world of crypto.



