Pi Network Price Forecast: PI extends losses ahead of Protocol v28 Mainnet upgrade
- PI edges lower on Thursday, extending a bearish trend below a long-term descending trendline.
- Pi Network is scheduled to upgrade its Mainnet to Protocol v28 on Friday, advancing its efforts to improve network operations.
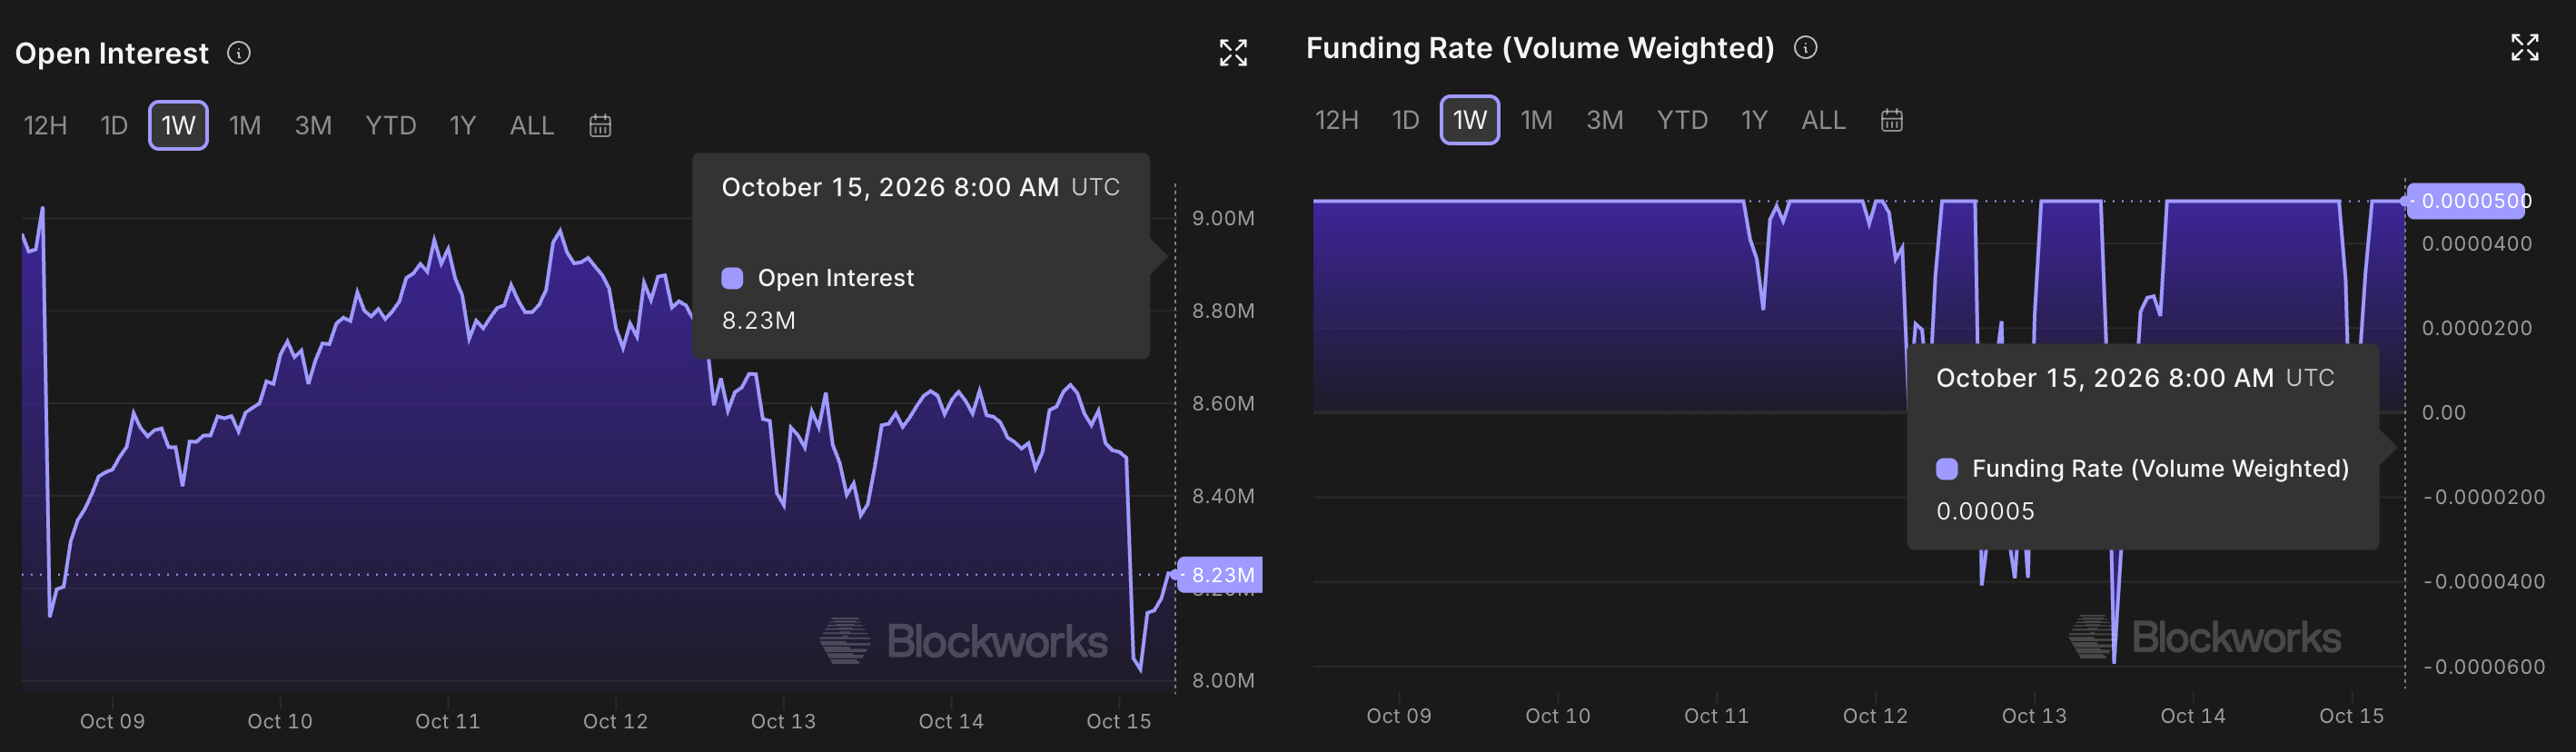
- A sharp decline in PI futures Open Interest, while funding rates remain positive, highlights mixed signals in derivatives markets.

Pi Network (PI) trades around $0.0780 at press time on Thursday, rising from $0.0740 earlier in the day. Pi Mainnet is scheduled for the Protocol v28 upgrade on Friday, focusing on data handling and smart contract maintenance. Retail sentiment remains mixed in PI futures, with declining Open Interest despite positive funding rates.
Could Protocol v28 upgrade boost PI token price?
Pi Network is scheduled to upgrade its Mainnet to Protocol v28 on Friday, which is already live on its testnet2. Pi node operators were required to complete necessary upgrades before Tuesday. The v28 upgrade builds on prior Stellar-based protocol enhancements without altering balances or mining. However, such infrastructure changes primarily benefit developers and network stability rather than directly driving token value, as seen with v27 and previous upgrades.
Retail demand remains weak
Pi Network is losing retail demand despite the upcoming v28 upgrade. Blockworks data shows that PI futures Open Interest (OI) is down to $8.23 million on Thursday, from $49.03 million last week, indicating a lower notional value of active contracts. At the same time, the funding rate remains marginally positive at 0.000050%, suggesting mixed-to-bearish sentiment among traders.
Technical outlook: Could Pi Network decline to a fresh record low?
Pi Network trades at $0.0782 on Thursday, extending a long-term bearish phase below both the 50-day and 200-day Exponential Moving Averages (EMAs) at $0.0877 and $0.1196, respectively.
PI remains capped beneath the descending trendline break level at $0.0860, which connects the June 20 and August 22 highs, testing a bearish breakout of the previous week's low at $0.0774. A confirmed bearish close below this level could test the previous swing low at $0.0704, where any deeper pullback could result in a new record low.
Momentum remains weak on the daily chart, with the Relative Strength Index (RSI) hovering near 35 and the Moving Average Convergence Divergence (MACD) in negative territory, with the MACD line below its signal line and a slightly contracting bearish histogram, hinting at persistent but not accelerating downside.
On the topside, initial resistance is clustered between the trendline break at $0.0860, reinforced by the 23.6% retracement at $0.0867, measured from $0.1349 to $0.0704, and the 50-day EMA at $0.0877, where any rebound would likely stall first.
(The technical analysis of this story was written with the help of an AI tool. Know more.)
Author

Vishal Dixit
FXStreet
Vishal Dixit holds a B.Sc. in Chemistry from Wilson College but found his true calling in the world of crypto.




