Pepe Price Forecast: Bullish metrics signal potential trend reversal
- Pepe extends gains on Monday following a 3% rise the previous day.
- On-chain data shows a surge in whale demand amid easing supply pressure on exchanges.
- Retail demand builds with an 11% rise in Open Interest over the last 24 hours, aligning with near-term gains.

Pepe (PEPE) edges higher on Monday, maintaining a near-term recovery tone seen over the last three weeks. Risk appetite among large wallet investors, commonly referred to as whales, for PEPE is rising, amid declining supply available on exchanges. Retail demand is also increasing, with PEPE futures Open Interest up 11% in 24 hours.
Technically, PEPE should reclaim its 50-day Exponential Moving Average (EMA) around $0.000002850 for a sustained recovery in the short term.
Whales are back for PEPE
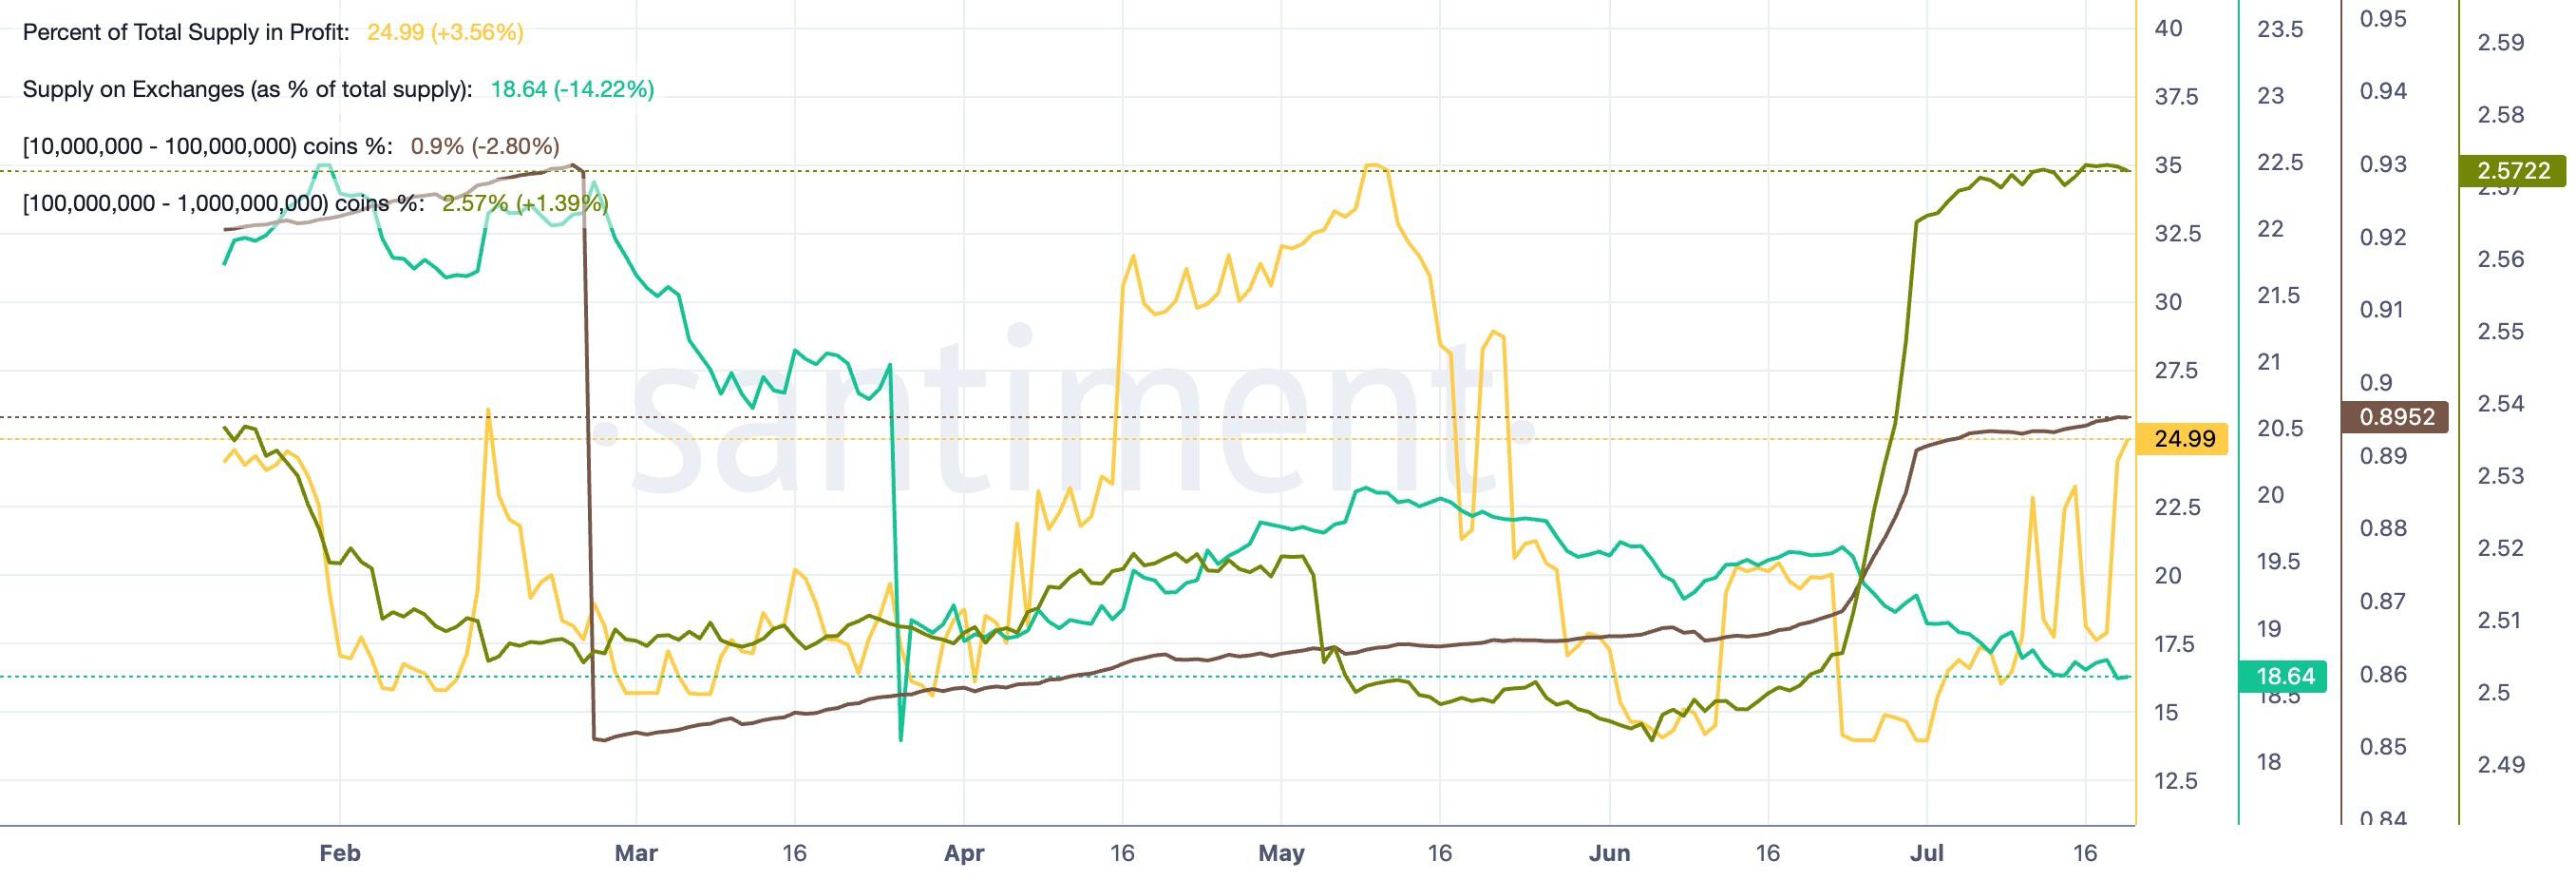
Recovery runs in meme coins such as Pepe depend heavily on whale demand. Santiment data show wallets with 10 million to 1 billion now hold 0.89% of the total supply, up from 0.85% on February 25, while cohorts with 1 billion to 10 billion now dominate 2.57% of the supply, up from 2.51% in the same period. Together, these whale cohorts reflect a long-term bullish outlook for PEPE. In addition, the total supply in profit is now at nearly 25% on Monday, reflecting a near-term recovery.
At the same time, supply on exchanges is down to 18.64% from 22.35% in the same period, suggesting that whales are buying the dip.
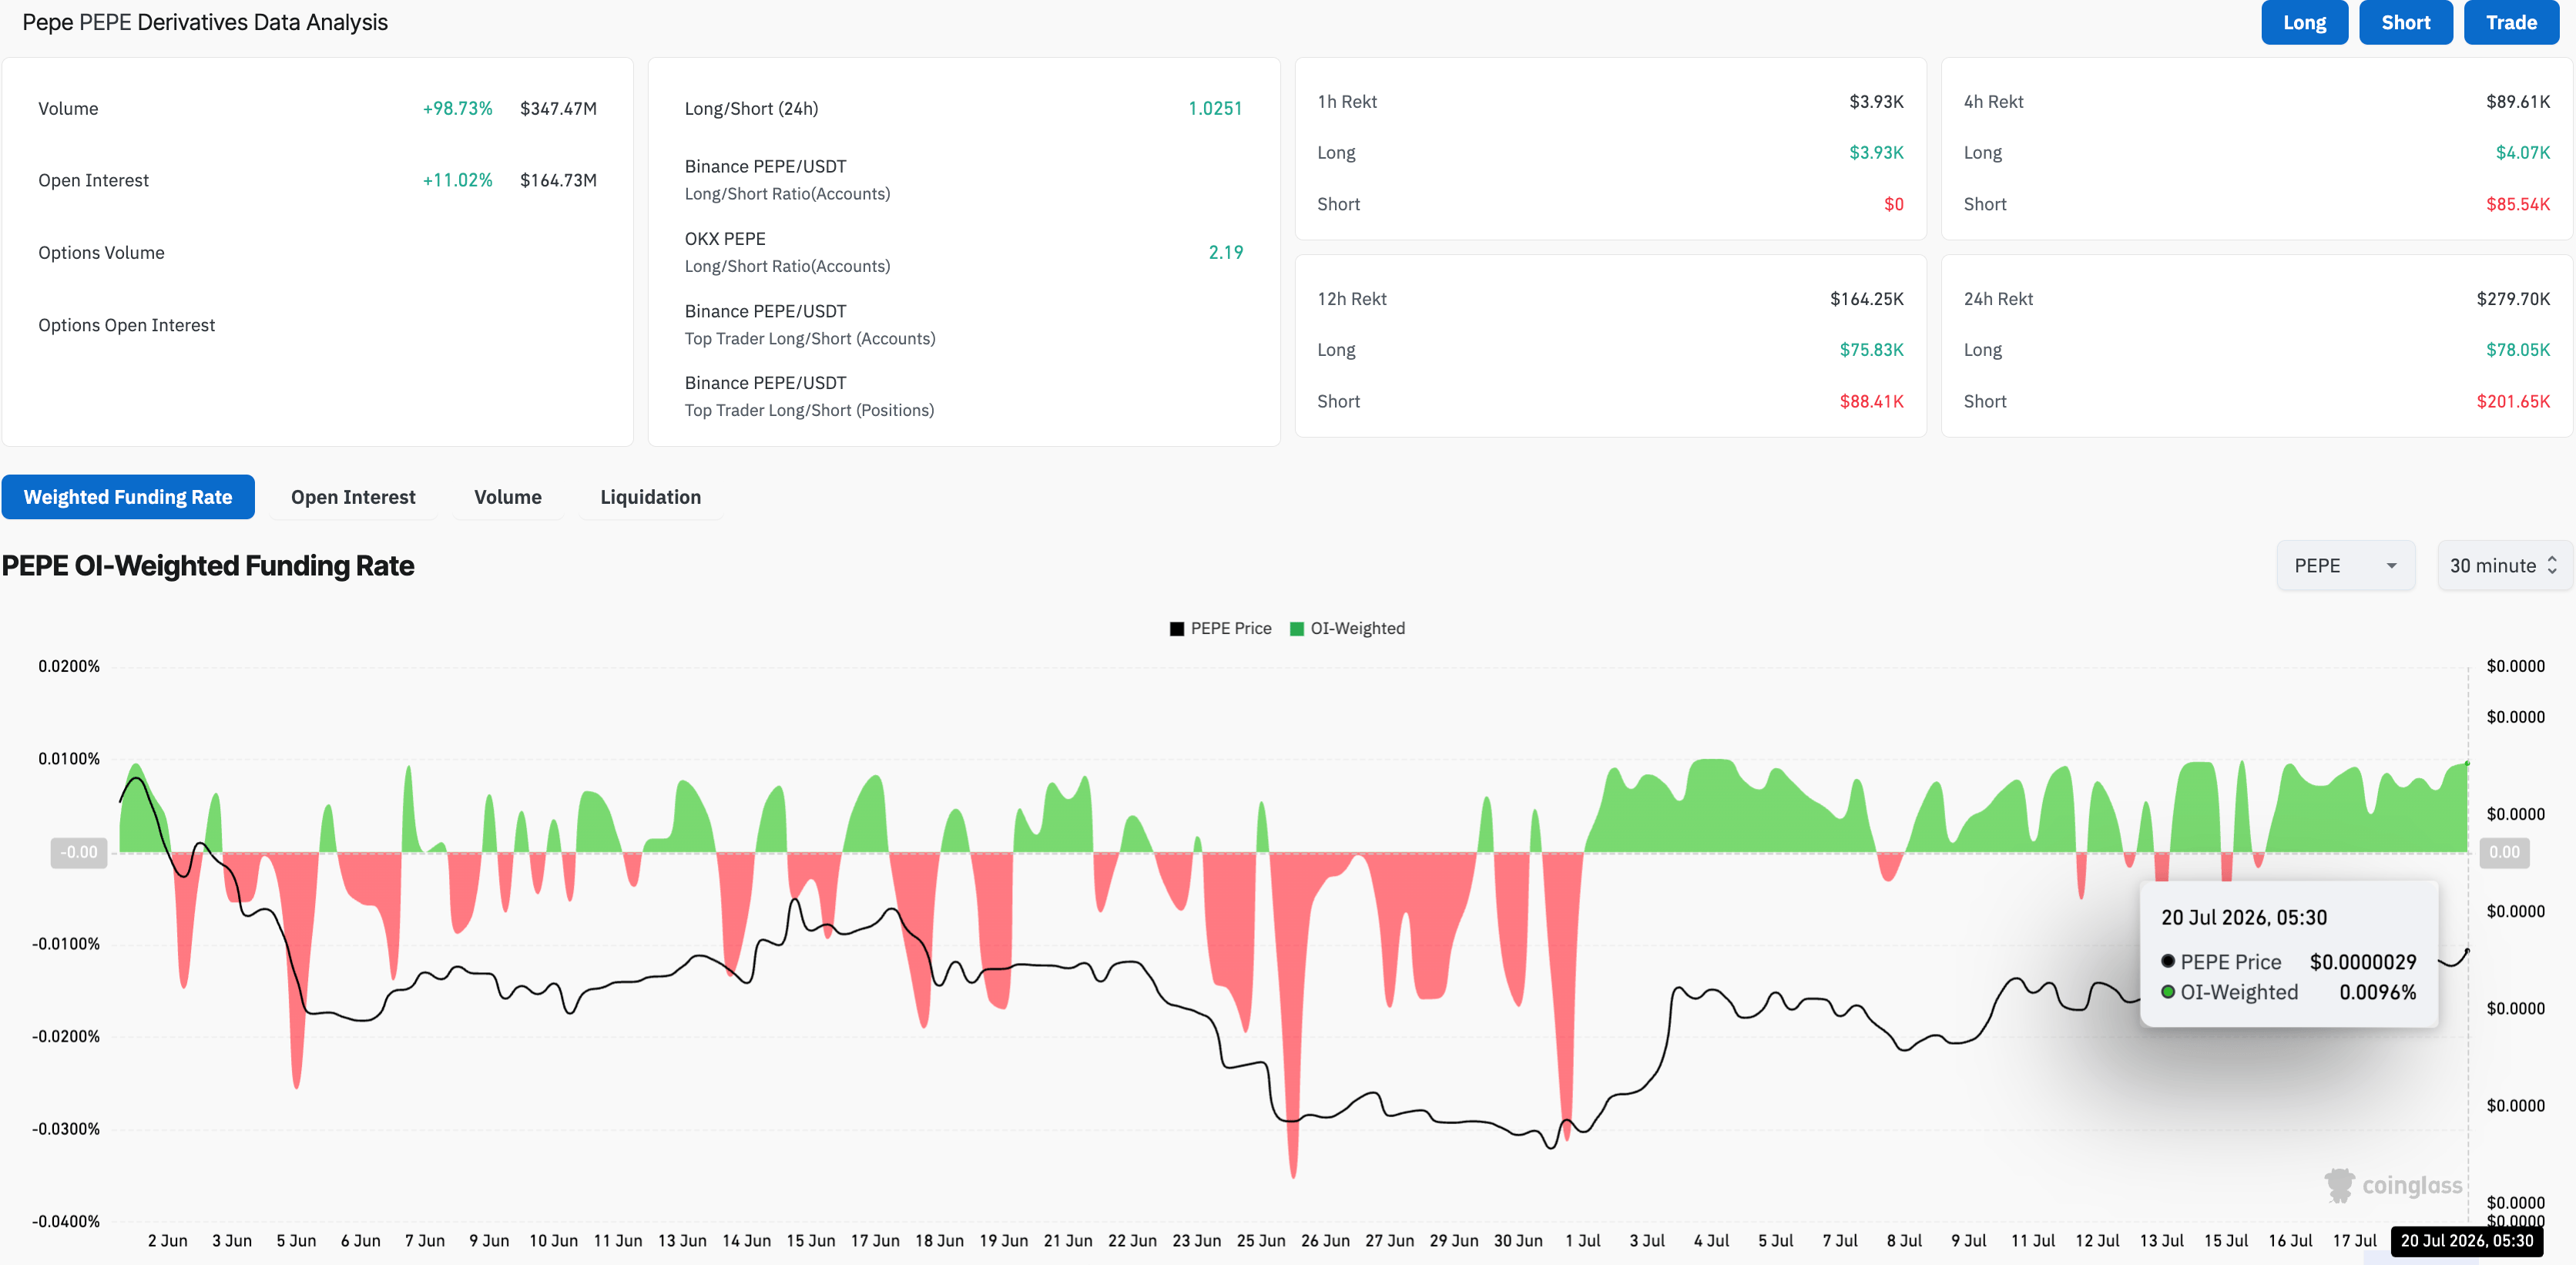
On the retail front, PEPE is regaining strength. CoinGlass data show that PEPE futures Open Interest is up 11% over the last 24 hours to $164.73 million, indicating a positional buildup, with trading volume up 98% to $347.47 million in the same period. The positive funding rate of 0.0096% implies a bullish bias in the buildup as traders are willing to buy long positions at a premium. However, these leverage-based positions are often at higher risk of liquidation in case of a pullback, which could deepen Pepe’s downside.
Technical outlook: Will Pepe extend its recovery?
Pepe edges higher on Monday, testing the breakout of its 50-day EMA around $0.000002850 after maintaining flat structure below it last week. The 23.60% Fibonacci retracement level at $0.000002659, measured from $0.000004571 to $0.000002249, serves as immediate support, underpinning the near-term recovery.
The Relative Strength Index (RSI) is near 59, reflecting renewed bullish momentum after a recovery from prior oversold extremes. Meanwhile, the Moving Average Convergence Divergence (MACD) is rising toward the zero line alongside its signal line, reinforcing a mild bullish bias.
A decisive close above the 50-day EMA at $0.000002850 could target the 50% retracement level at $0.000003206, followed by the 200-day EMA at $0.000003893.
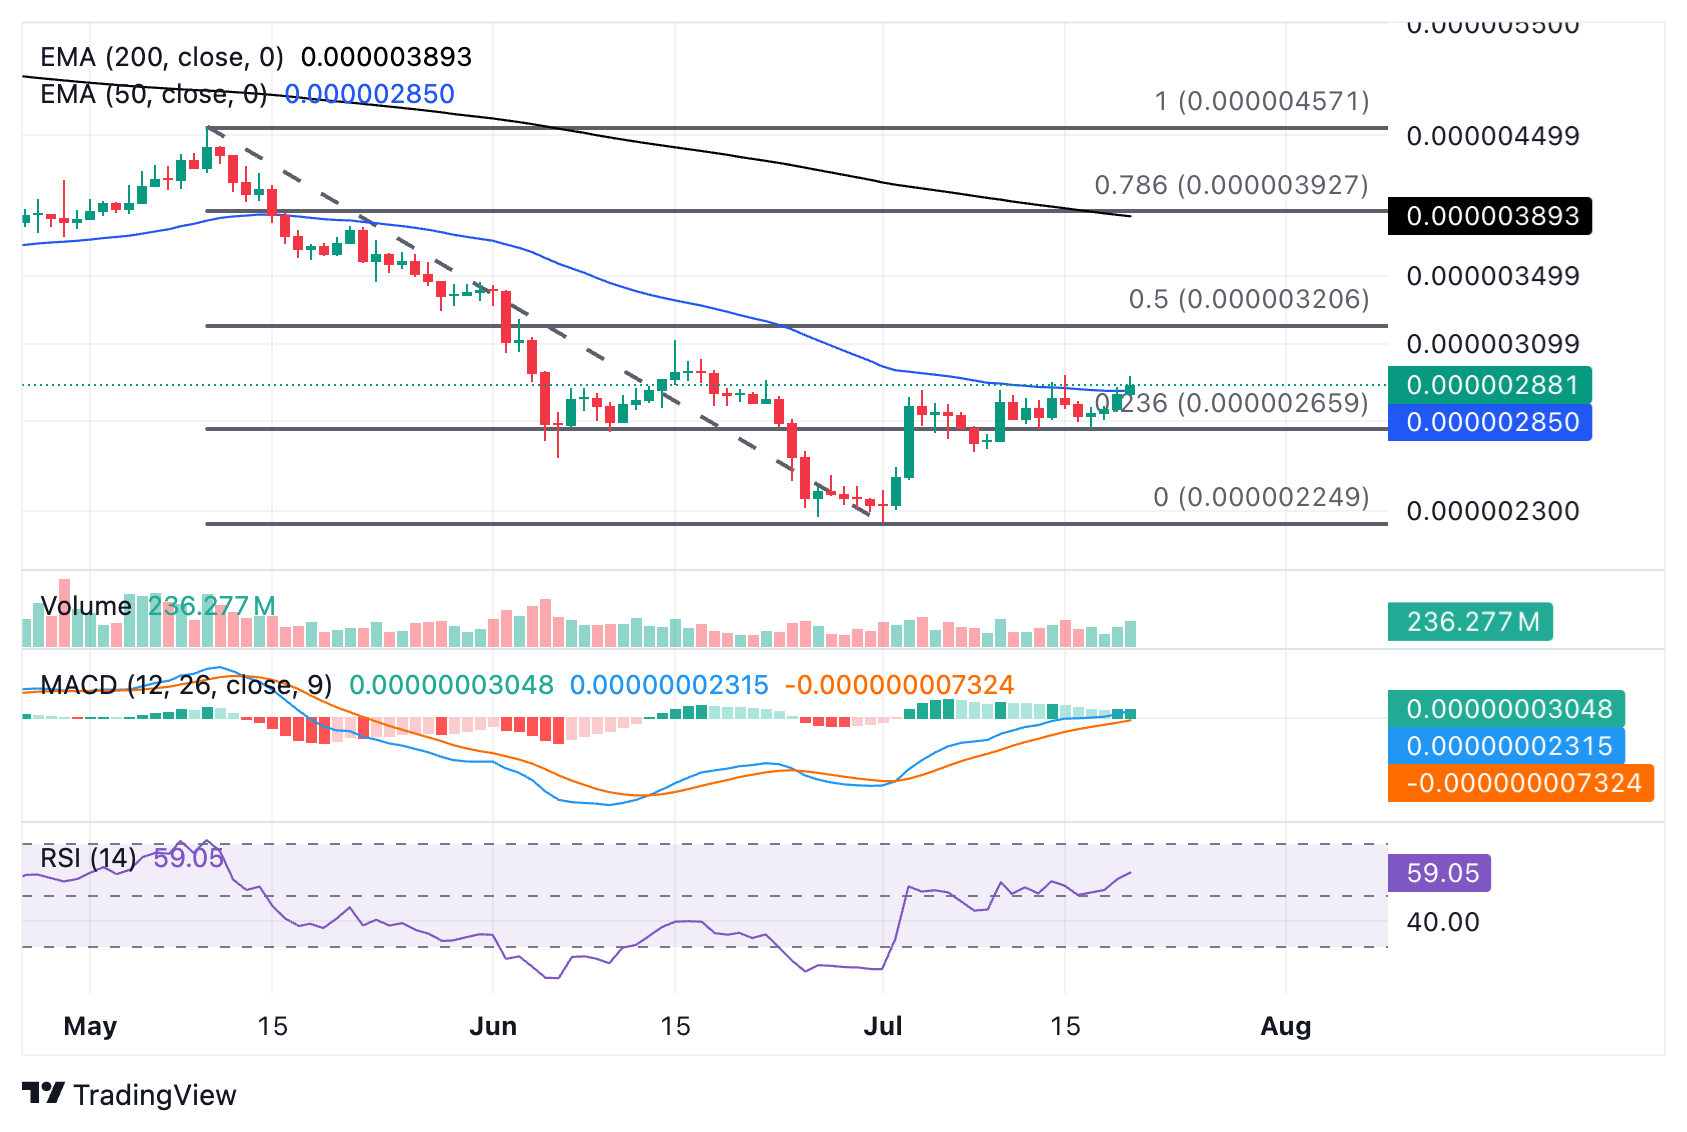
Looking down, the $0.000002659 support level guards the downside to the previous swing low of $0.000002249.
(The technical analysis of this story was written with the help of an AI tool. Know more.)
Author

Vishal Dixit
FXStreet
Vishal Dixit holds a B.Sc. in Chemistry from Wilson College but found his true calling in the world of crypto.




