• NEO/USD bulls have pushed the price above the 20-day Bollinger Band, showing that it’s presently overvalued.
  • The RSI indicator and William’s %R are both trending inside the overbought zone.

NEO/USD daily chart

NEO/USD daily chart

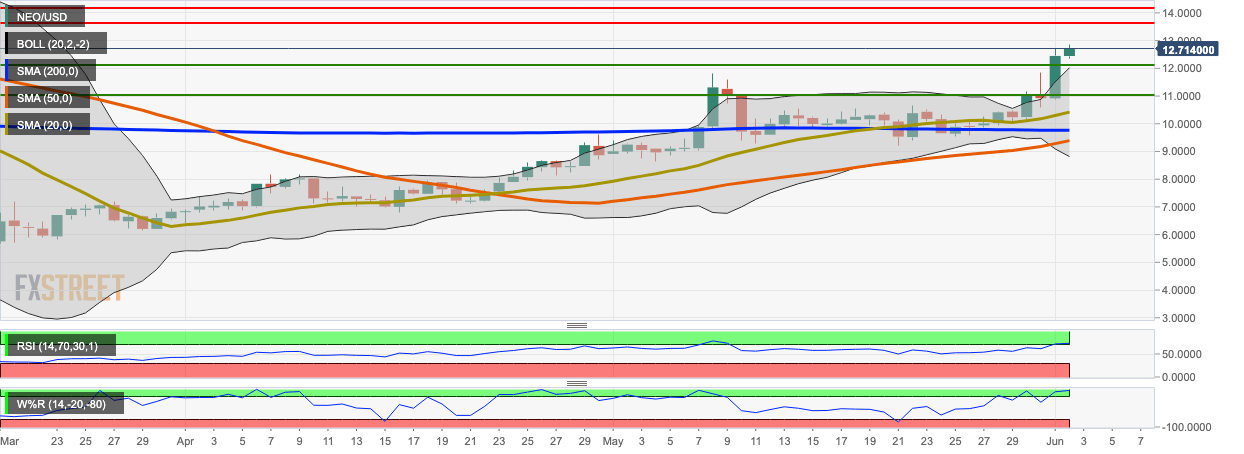
NEO/USD went up from $12.45 to $12.72 in the early hours of Tuesday as the bulls stayed in control for the second straight day. The price has jumped above the 20-day Bollinger Band, indicating that it’s presently overvalued. Both the RSI indicator and William’s %R are trending inside the overbought zone, so a bearish correction is around the corner. 

Support and Resistance

NEO/USD faces stiff resistance at $13.64 and $14.21. On the downside, healthy resistance lies at  $12.15, $11, SMA 20, SMA 200 and SMA 50.

Key levels

NEO/USD

Overview
Today last price 12.716
Today Daily Change 0.26880
Today Daily Change % 2.16
Today daily open 12.4472
 
Trends
Daily SMA20 10.2994
Daily SMA50 9.2837
Daily SMA100 8.86294
Daily SMA200 9.76411
 
Levels
Previous Daily High 12.703
Previous Daily Low 10.878
Previous Weekly High 10.496
Previous Weekly Low 9.5425
Previous Monthly High 12.31
Previous Monthly Low 8.3801
Daily Fibonacci 38.2% 12.00585
Daily Fibonacci 61.8% 11.57515
Daily Pivot Point S1 11.3158
Daily Pivot Point S2 10.1844
Daily Pivot Point S3 9.4908
Daily Pivot Point R1 13.1408
Daily Pivot Point R2 13.8344
Daily Pivot Point R3 14.9658


Note: All information on this page is subject to change. The use of this website constitutes acceptance of our user agreement. Please read our privacy policy and legal disclaimer. Opinions expressed at FXstreet.com are those of the individual authors and do not necessarily represent the opinion of FXstreet.com or its management. Risk Disclosure: Trading foreign exchange on margin carries a high level of risk, and may not be suitable for all investors. The high degree of leverage can work against you as well as for you. Before deciding to invest in foreign exchange you should carefully consider your investment objectives, level of experience, and risk appetite. The possibility exists that you could sustain a loss of some or all of your initial investment and therefore you should not invest money that you cannot afford to lose. You should be aware of all the risks associated with foreign exchange trading, and seek advice from an independent financial advisor if you have any doubts.

Join Telegram

Recommended content


Recommended Content

Editors’ Picks

Why crypto may see a recovery right before or shortly after Bitcoin halving

Why crypto may see a recovery right before or shortly after Bitcoin halving

Cryptocurrency market is bleeding, with Bitcoin price leading altcoins south in a broader market crash. The elevated risk levels have bulls sitting on their hands, but analysts from Santiment say this bleed may only be cauterized right before or shortly after the halving.

More Cryptocurrencies News

Manta Network price braces for volatility as $44 million worth of MANTA is due to flood markets

Manta Network price braces for volatility as $44 million worth of MANTA is due to flood markets

Manta Network (MANTA) price was not spared from the broader market crash instigated by a weakness in the Bitcoin (BTC) market. While analysts call a bottoming out in the BTC price, the Web3 modular ecosystem token could suffer further impact.

More Manta Network News

Bitcoin price uptrend to continue post-halving, Bernstein report says as traders remain in disarray

Bitcoin price uptrend to continue post-halving, Bernstein report says as traders remain in disarray

Bitcoin is dropping amid elevated risk levels in the market. It comes as traders count hours to the much-anticipated halving event. Amid the market lull, experts say we may not see a rally until after the halving. 

More Bitcoin News

OMNI post nearly 50% loss after airdrop and exchange listing

OMNI post nearly 50% loss after airdrop and exchange listing

Omni network (OMNI) lost nearly 50% of its value on Wednesday after investors dumped the token following its listing on top crypto exchanges. A potential reason for the crash may be due to the wider crypto market slump.

More Omni Network News

Bitcoin: BTC’s rangebound movement leaves traders confused

Bitcoin: BTC’s rangebound movement leaves traders confused

Bitcoin (BTC) price has been hovering around the $70,000 psychological level for a few weeks, resulting in a rangebound movement. This development could lead to a massive liquidation on either side before a directional move is established. 

Read full analysis

BTC

ETH

XRP