Meme Coins Price Prediction: DOGE, SHIB, PEPE poised to benefit from improved risk sentiment
- Dogecoin eyes a crucial resistance breakout after posting a Golden Cross between two key moving averages.
- Shiba Inu recovers slightly, but remains within a symmetrical triangle pattern lacking direction.
- Pepe bounces off the 200-day EMA, eyeing further recovery.

The top meme coins by market capitalization —Dogecoin (DOGE), Shiba Inu (SHIB), and Pepe (PEPE) — have gained between 4% and 6% in the last 24 hours, underpinned by increased capital inflows from derivative traders and large-wallet investors. With the meme coin market capitalization recovering on Wednesday as risk sentiment improves, the chances of these tokens further recovering also increase.
Dogecoin eyes crucial resistance breakout
DOGE edges higher by nearly 6% at press time on Wednesday, extending the recovery run after the 6% rise on the previous day. Dogecoin’s short-term trend remains bullish as the 50-day Exponential Moving Average (EMA) crossed above the 200-day EMA on Friday, highlighting a Golden Cross.
As the first-ever meme coin exceeds the $0.2407 weekly resistance, a decisive close above this level could extend the meme coin rally to the $0.2848 resistance, last tested on July 21.
DOGE derivatives experience a surge in capital inflow as spot demand rises, resulting in an increase in Open Interest to $3.39 billion from $3.20 billion on Tuesday. The $190 million inflow reflects a significant increase in traders' interest, indicating anticipation of further recovery.
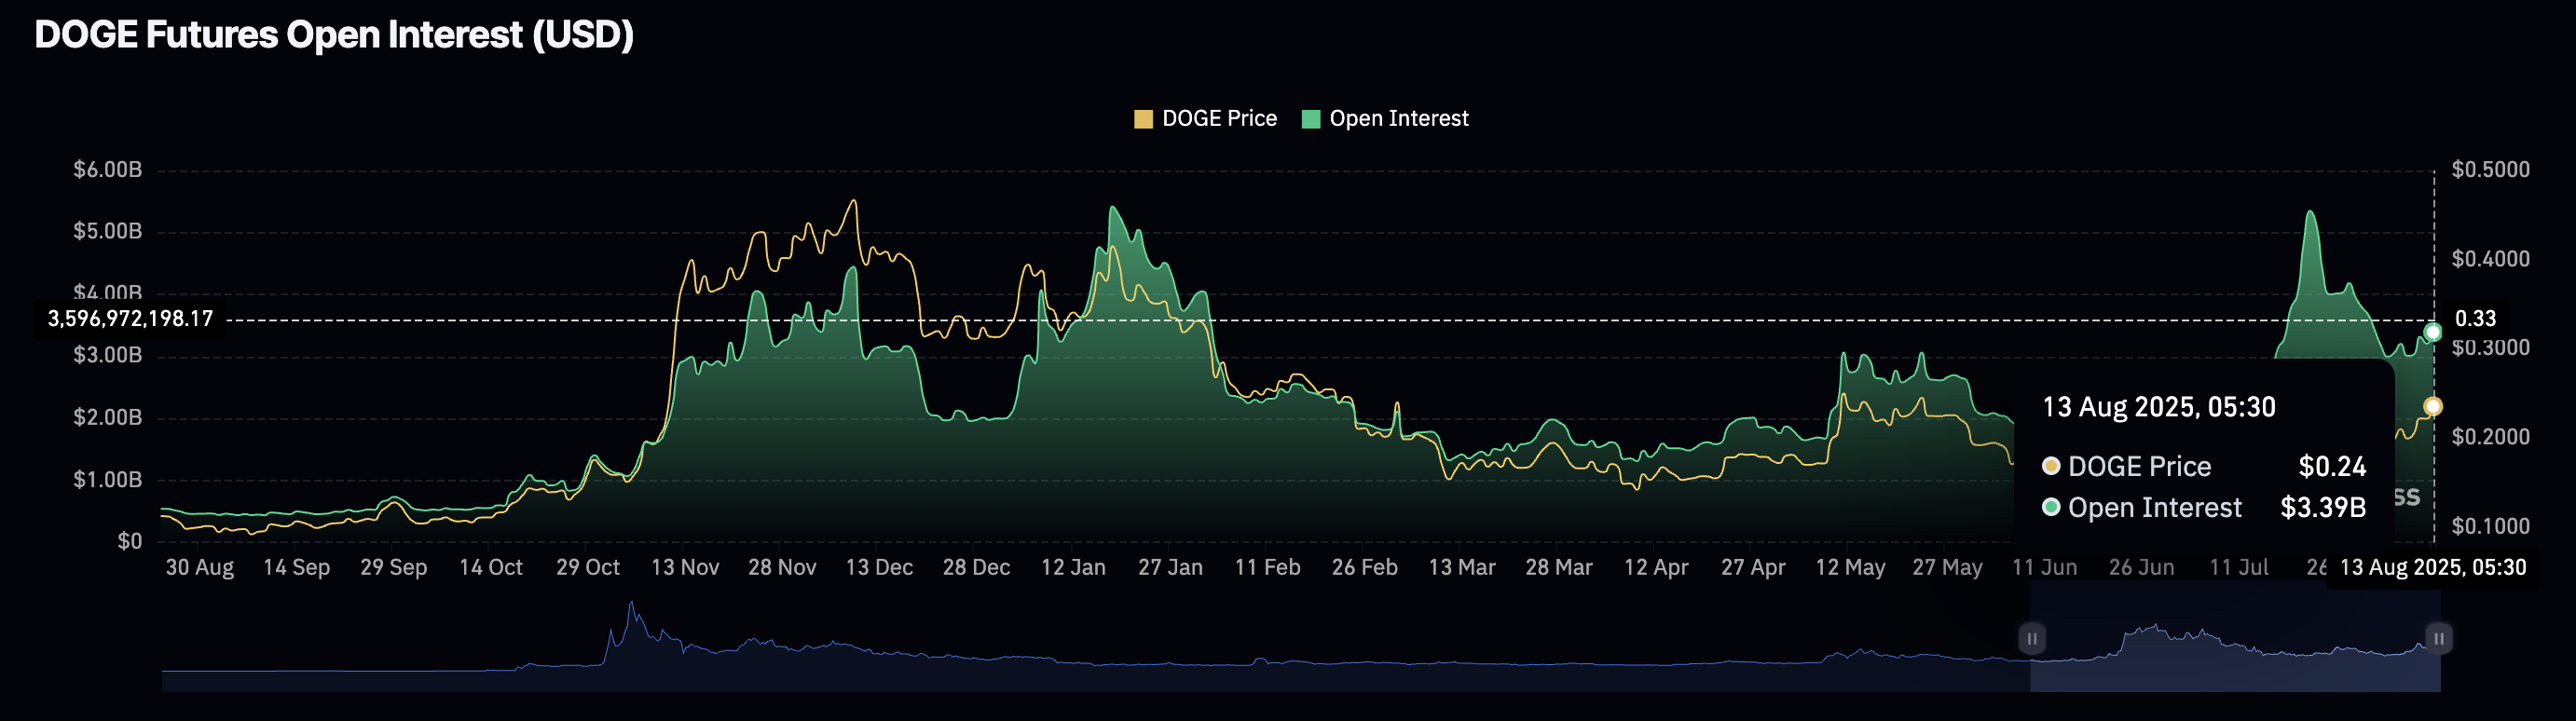
DOGE Open Interest. Source: Coinglass
The Relative Strength Index (RSI) reads 61 on the daily chart, pointing upwards, suggesting increasing buying pressure with further room for growth. Additionally, the Moving Average Convergence Divergence (MACD) line heads higher after crossing above its signal line on Saturday, suggesting the start of a renewed uptrend.
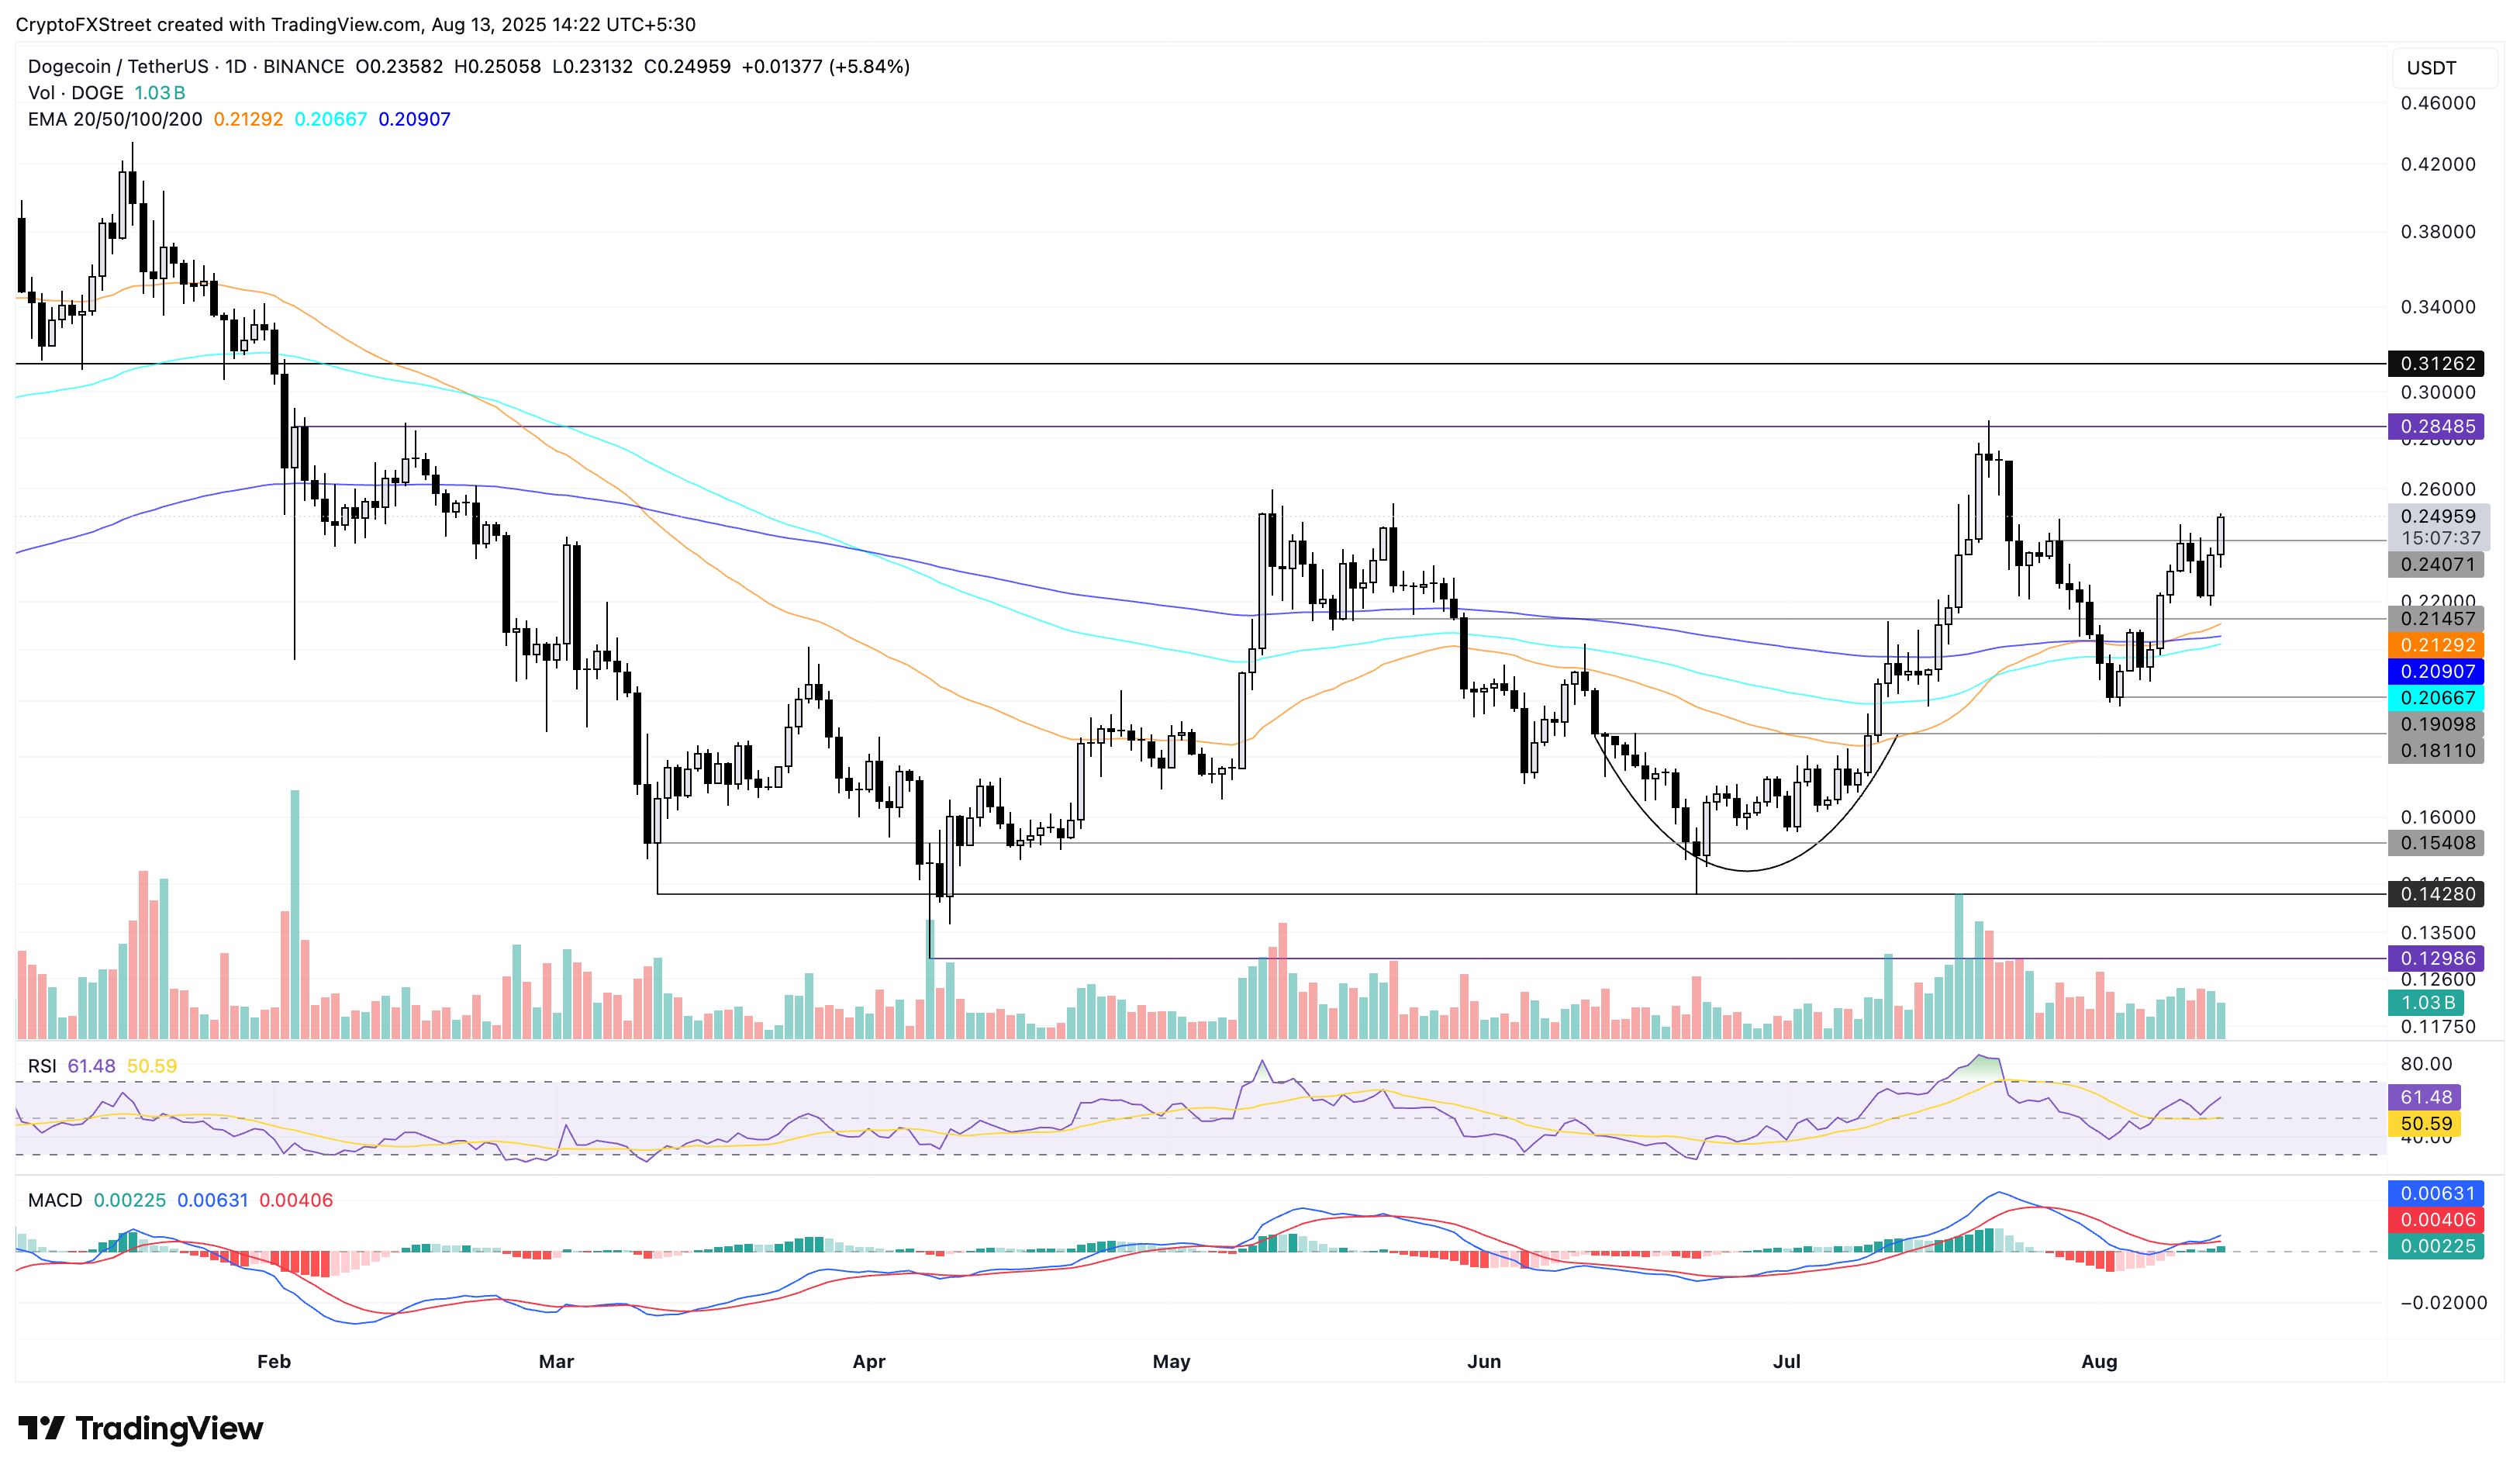
DOGE/USDT daily price chart.
Looking down, if DOGE reverses from the $0.2407 resistance level, it could retest the 50-day EMA at $0.2124.
Shiba Inu could extend gains as Open Interest jumps
Shiba Inu ticks higher by around 3% at press time on Wednesday, following a 4.72% rise on Tuesday. The meme coin maintains an uptrend within a symmetrical triangle pattern on the daily chart (shared below).
To extend the recovery towards the upper boundary line of the triangle pattern, SHIB should surpass the 200-day EMA at $0.00001425.
Similar to DOGE, the capital inflows in SHIB derivatives have increased its Open Interest to $161.96 million from $153.90 million on Tuesday.
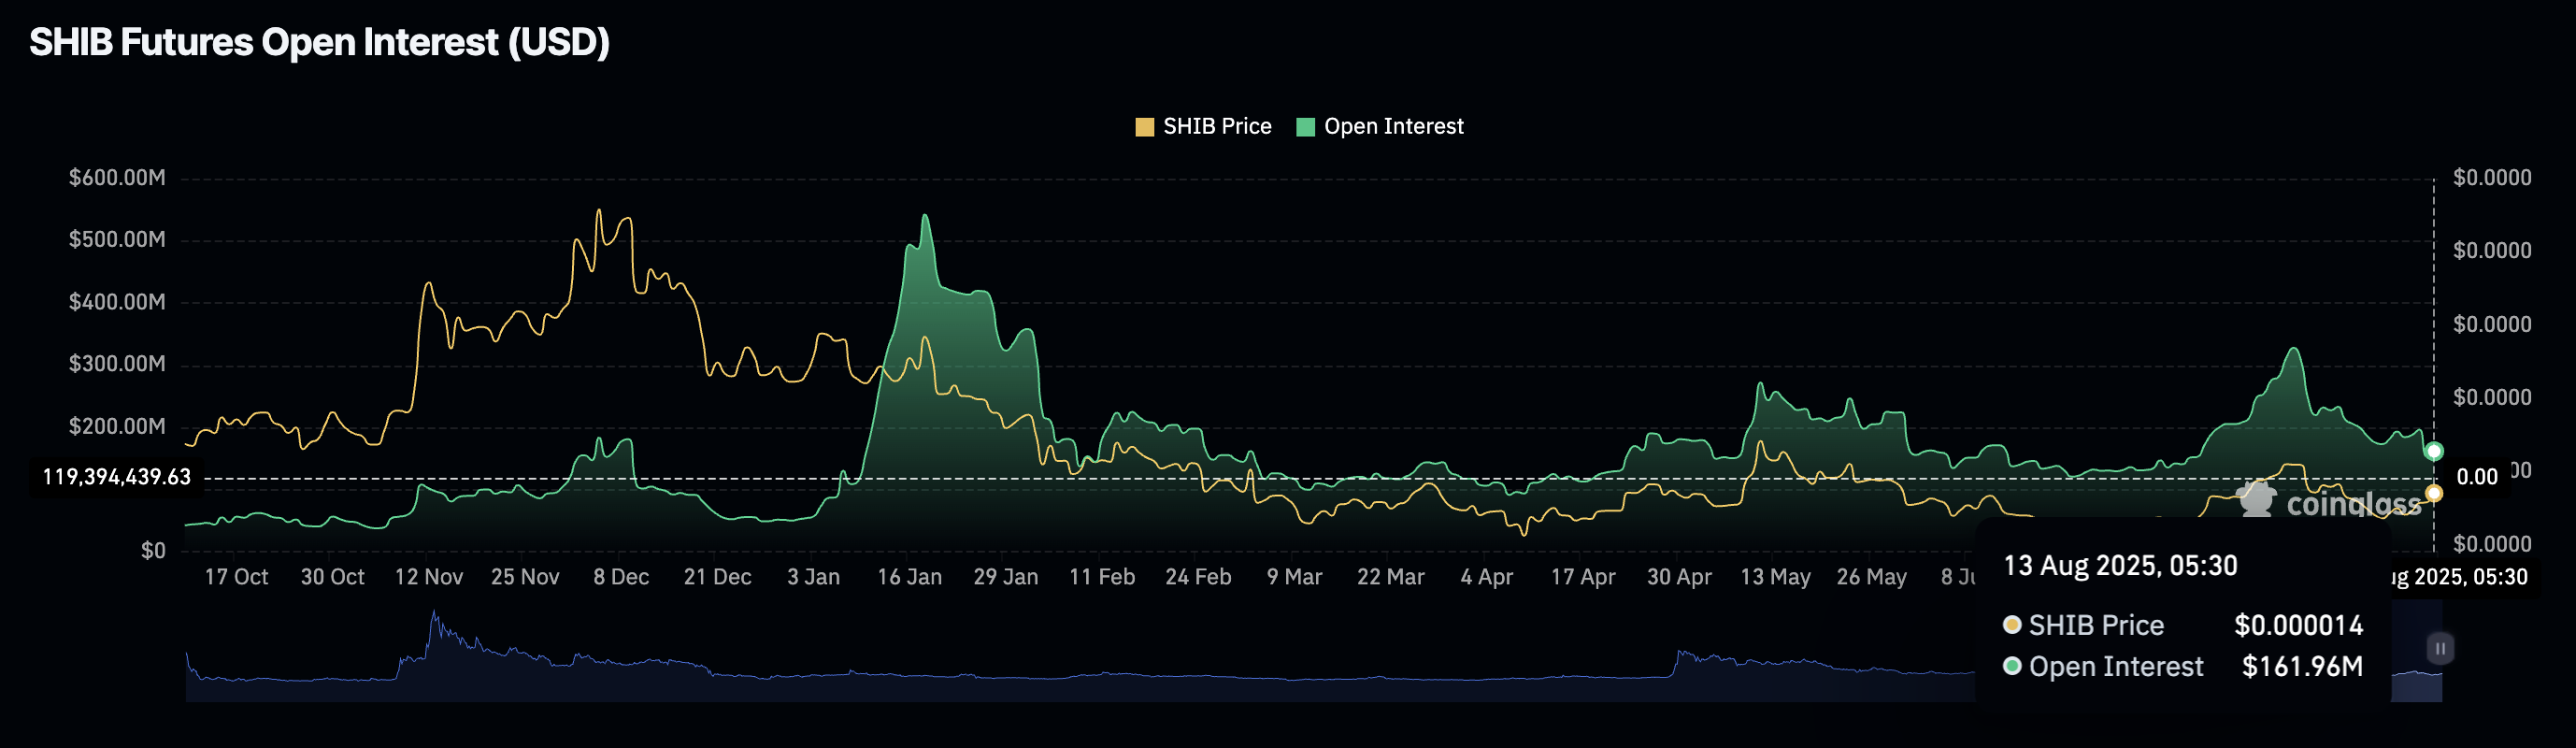
SHIB Open Interest. Source: Coinglass
The momentum indicators display a bullish inclination, as the RSI stands at 56 on the daily chart, indicating buying pressure above neutral levels. Additionally, the MACD line holds above the signal line after the recent crossover on Saturday. Sidelined investors could consider the MACD line crossing above the zero line as a buy signal.
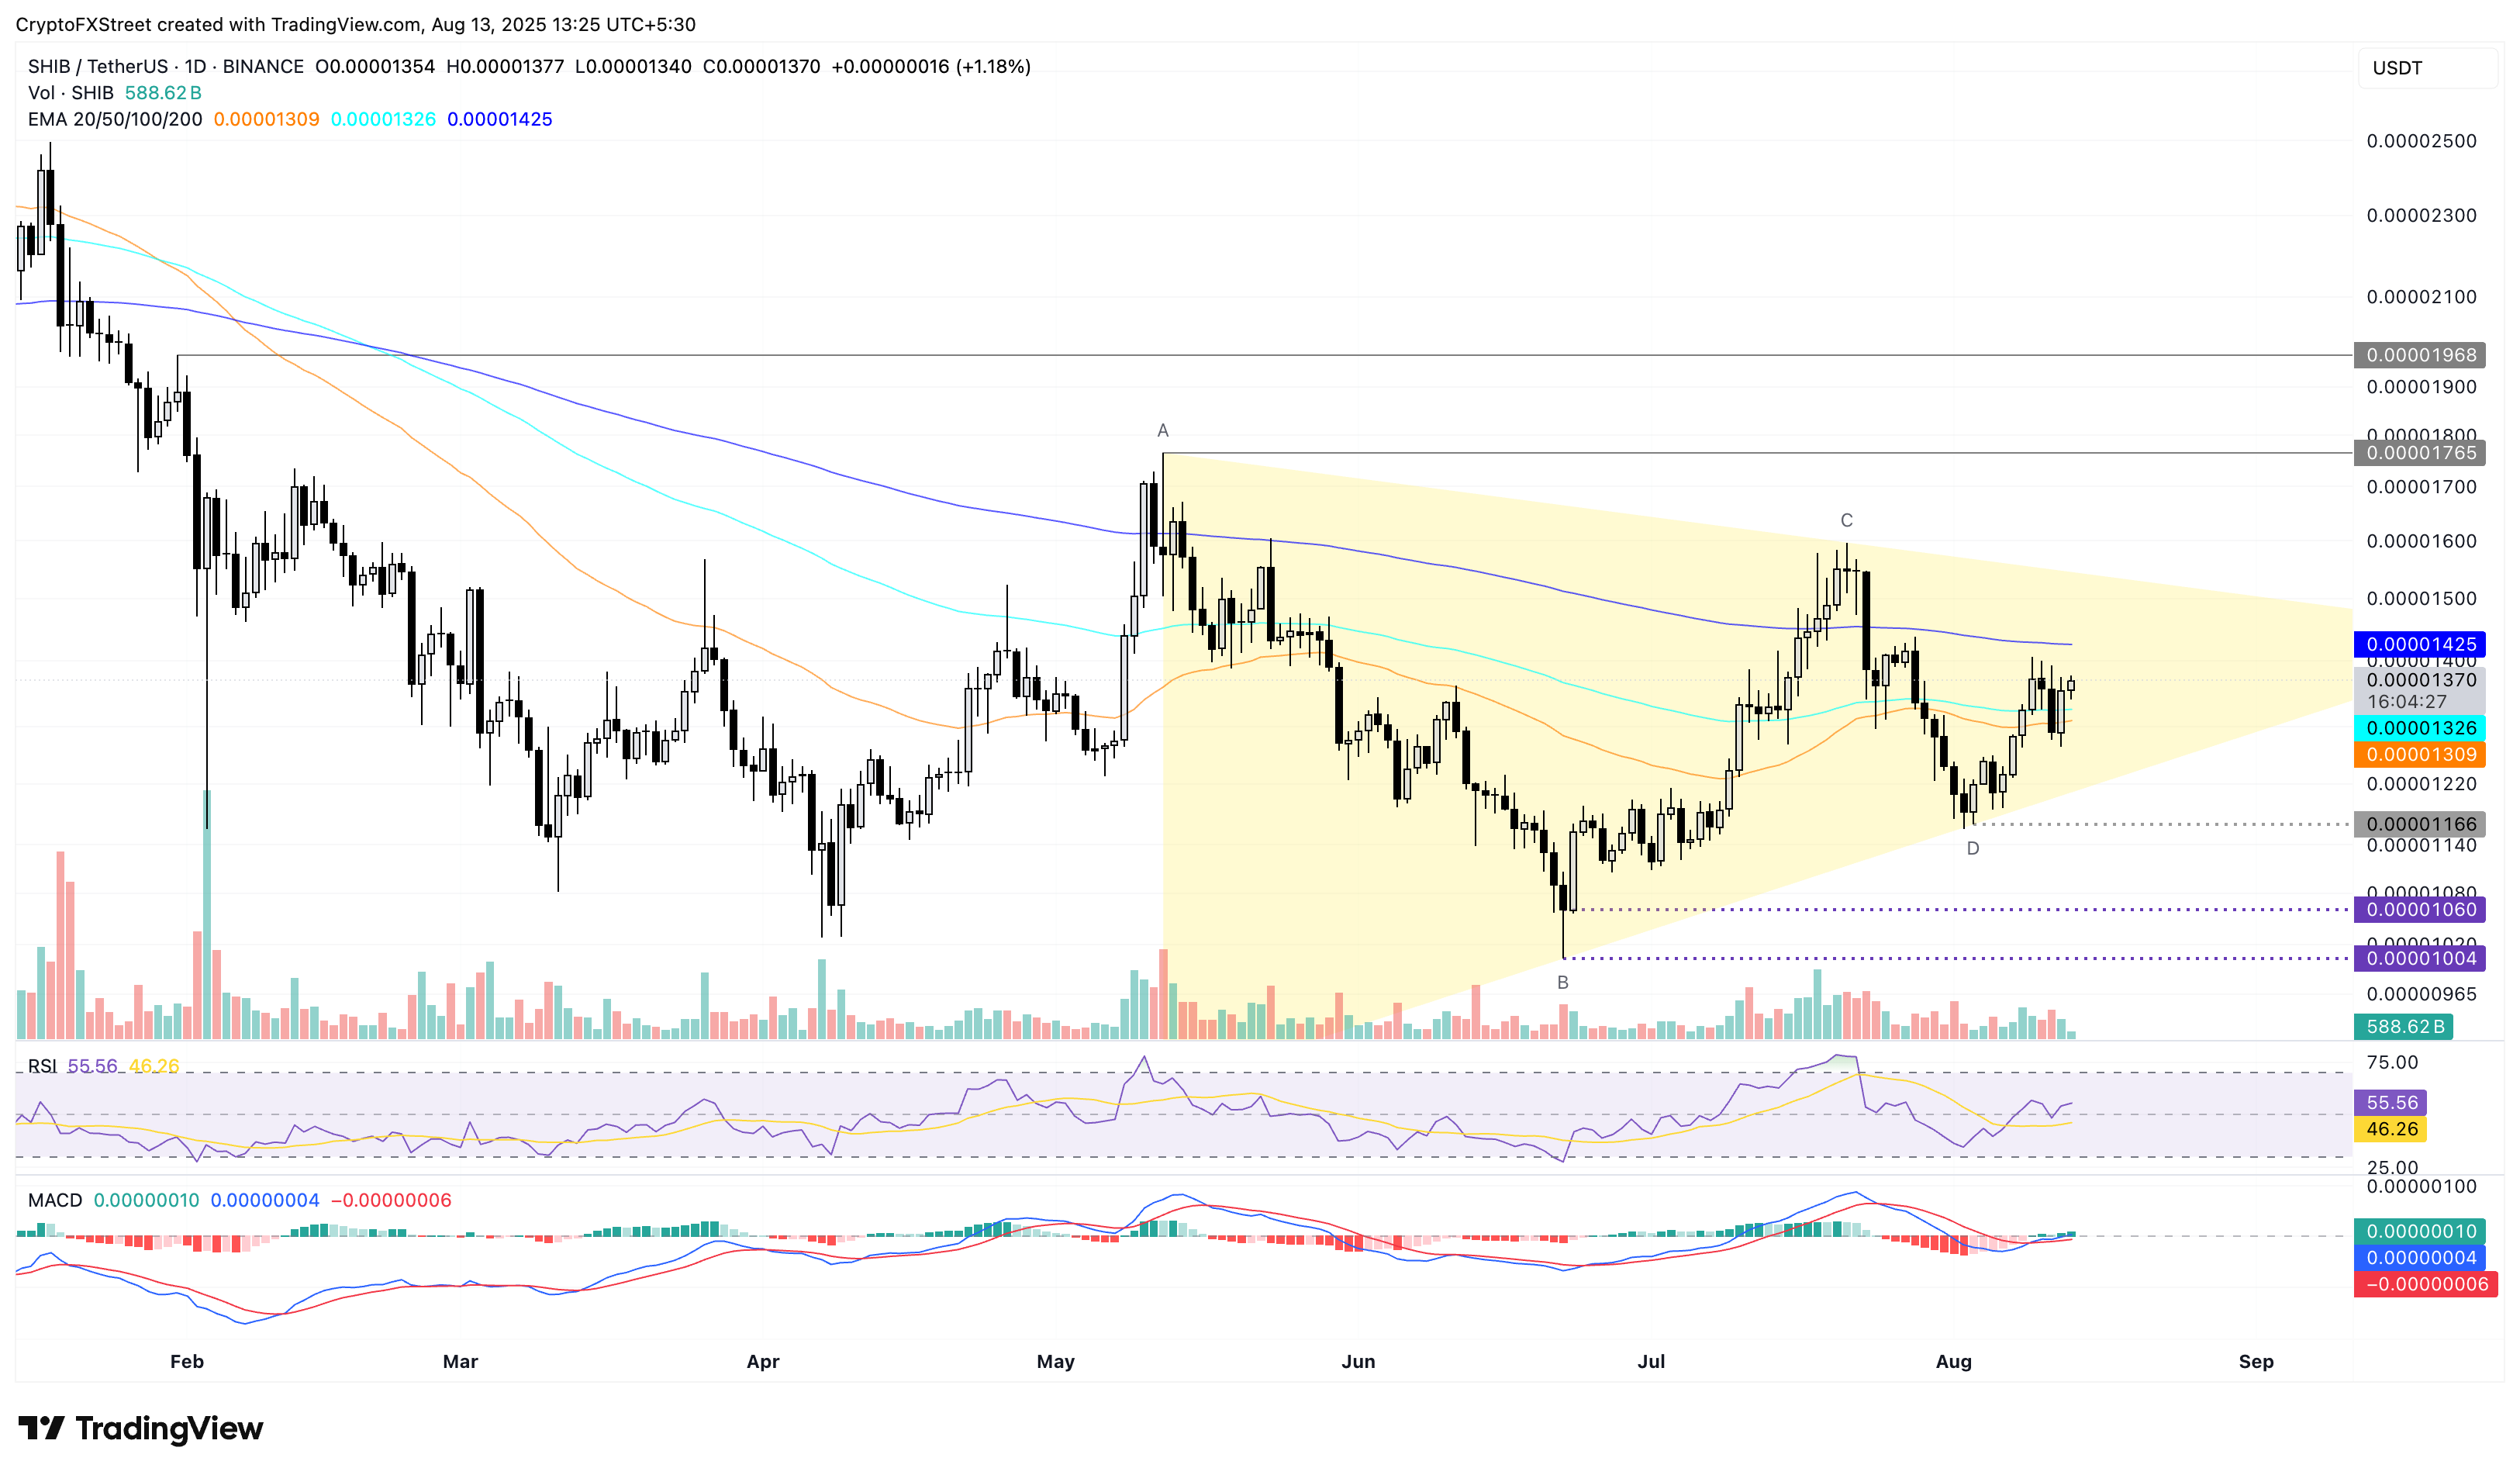
SHIB/USDT daily price chart.
On the other hand, a reversal in SHIB below the 50-day EMA would invalidate the positive trend within the triangle, potentially retesting the lower boundary near the $0.00001200 level.
Pepe eyes further recovery as whales’ interest could renew
Pepe, the frog-themed meme coin, holds a steady recovery of nearly 2% at the time of writing on Wednesday, continuing the 8% jump from the 200-day EMA on Tuesday. Similar to SHIB, the meme coin continues to maintain an upward trend within a symmetrical triangle pattern on the daily chart (shared below).
The immediate resistance at $0.00001362 stands close to the upper resistance trendline. A close above this level could extend the breakout rally to the $0.00001632 level, marked by the May 23 peak.
Santiment data shows the supply held by whales is 128.96 trillion PEPE on Wednesday, rising from the weekly low of 128.55 trillion PEPE. The whale supply stabilizing after the sell-off seen in June indicates the possibility of renewed interest.
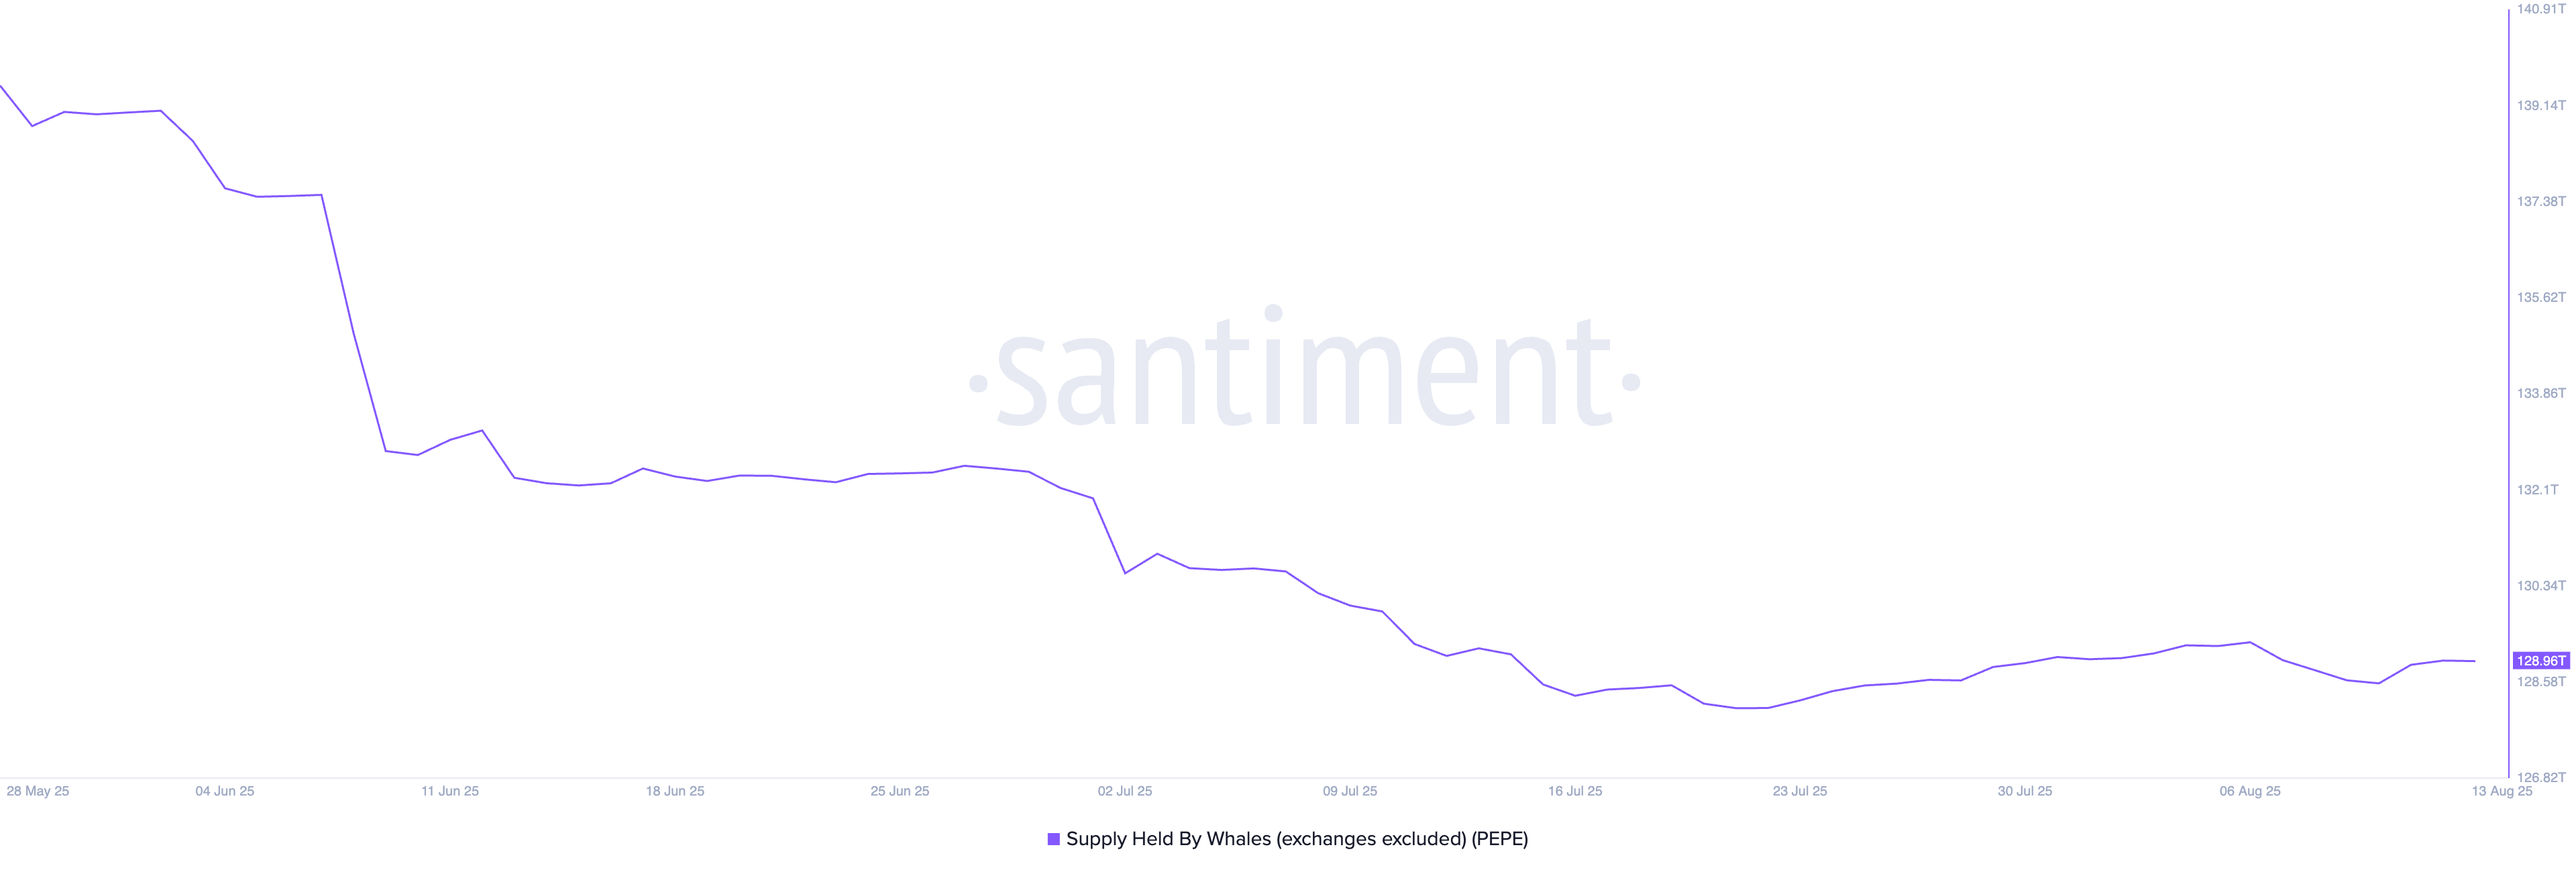
PEPE whale supply. Source: Santiment
Similar to SHIB, the momentum indicators maintain a bullish tilt as increasing buying pressure pushes the RSI above its neutral line to 55. Furthermore, the uptrending MACD and its signal line approach the zero line alongside rising green histogram bars, suggesting heightened bullish momentum.
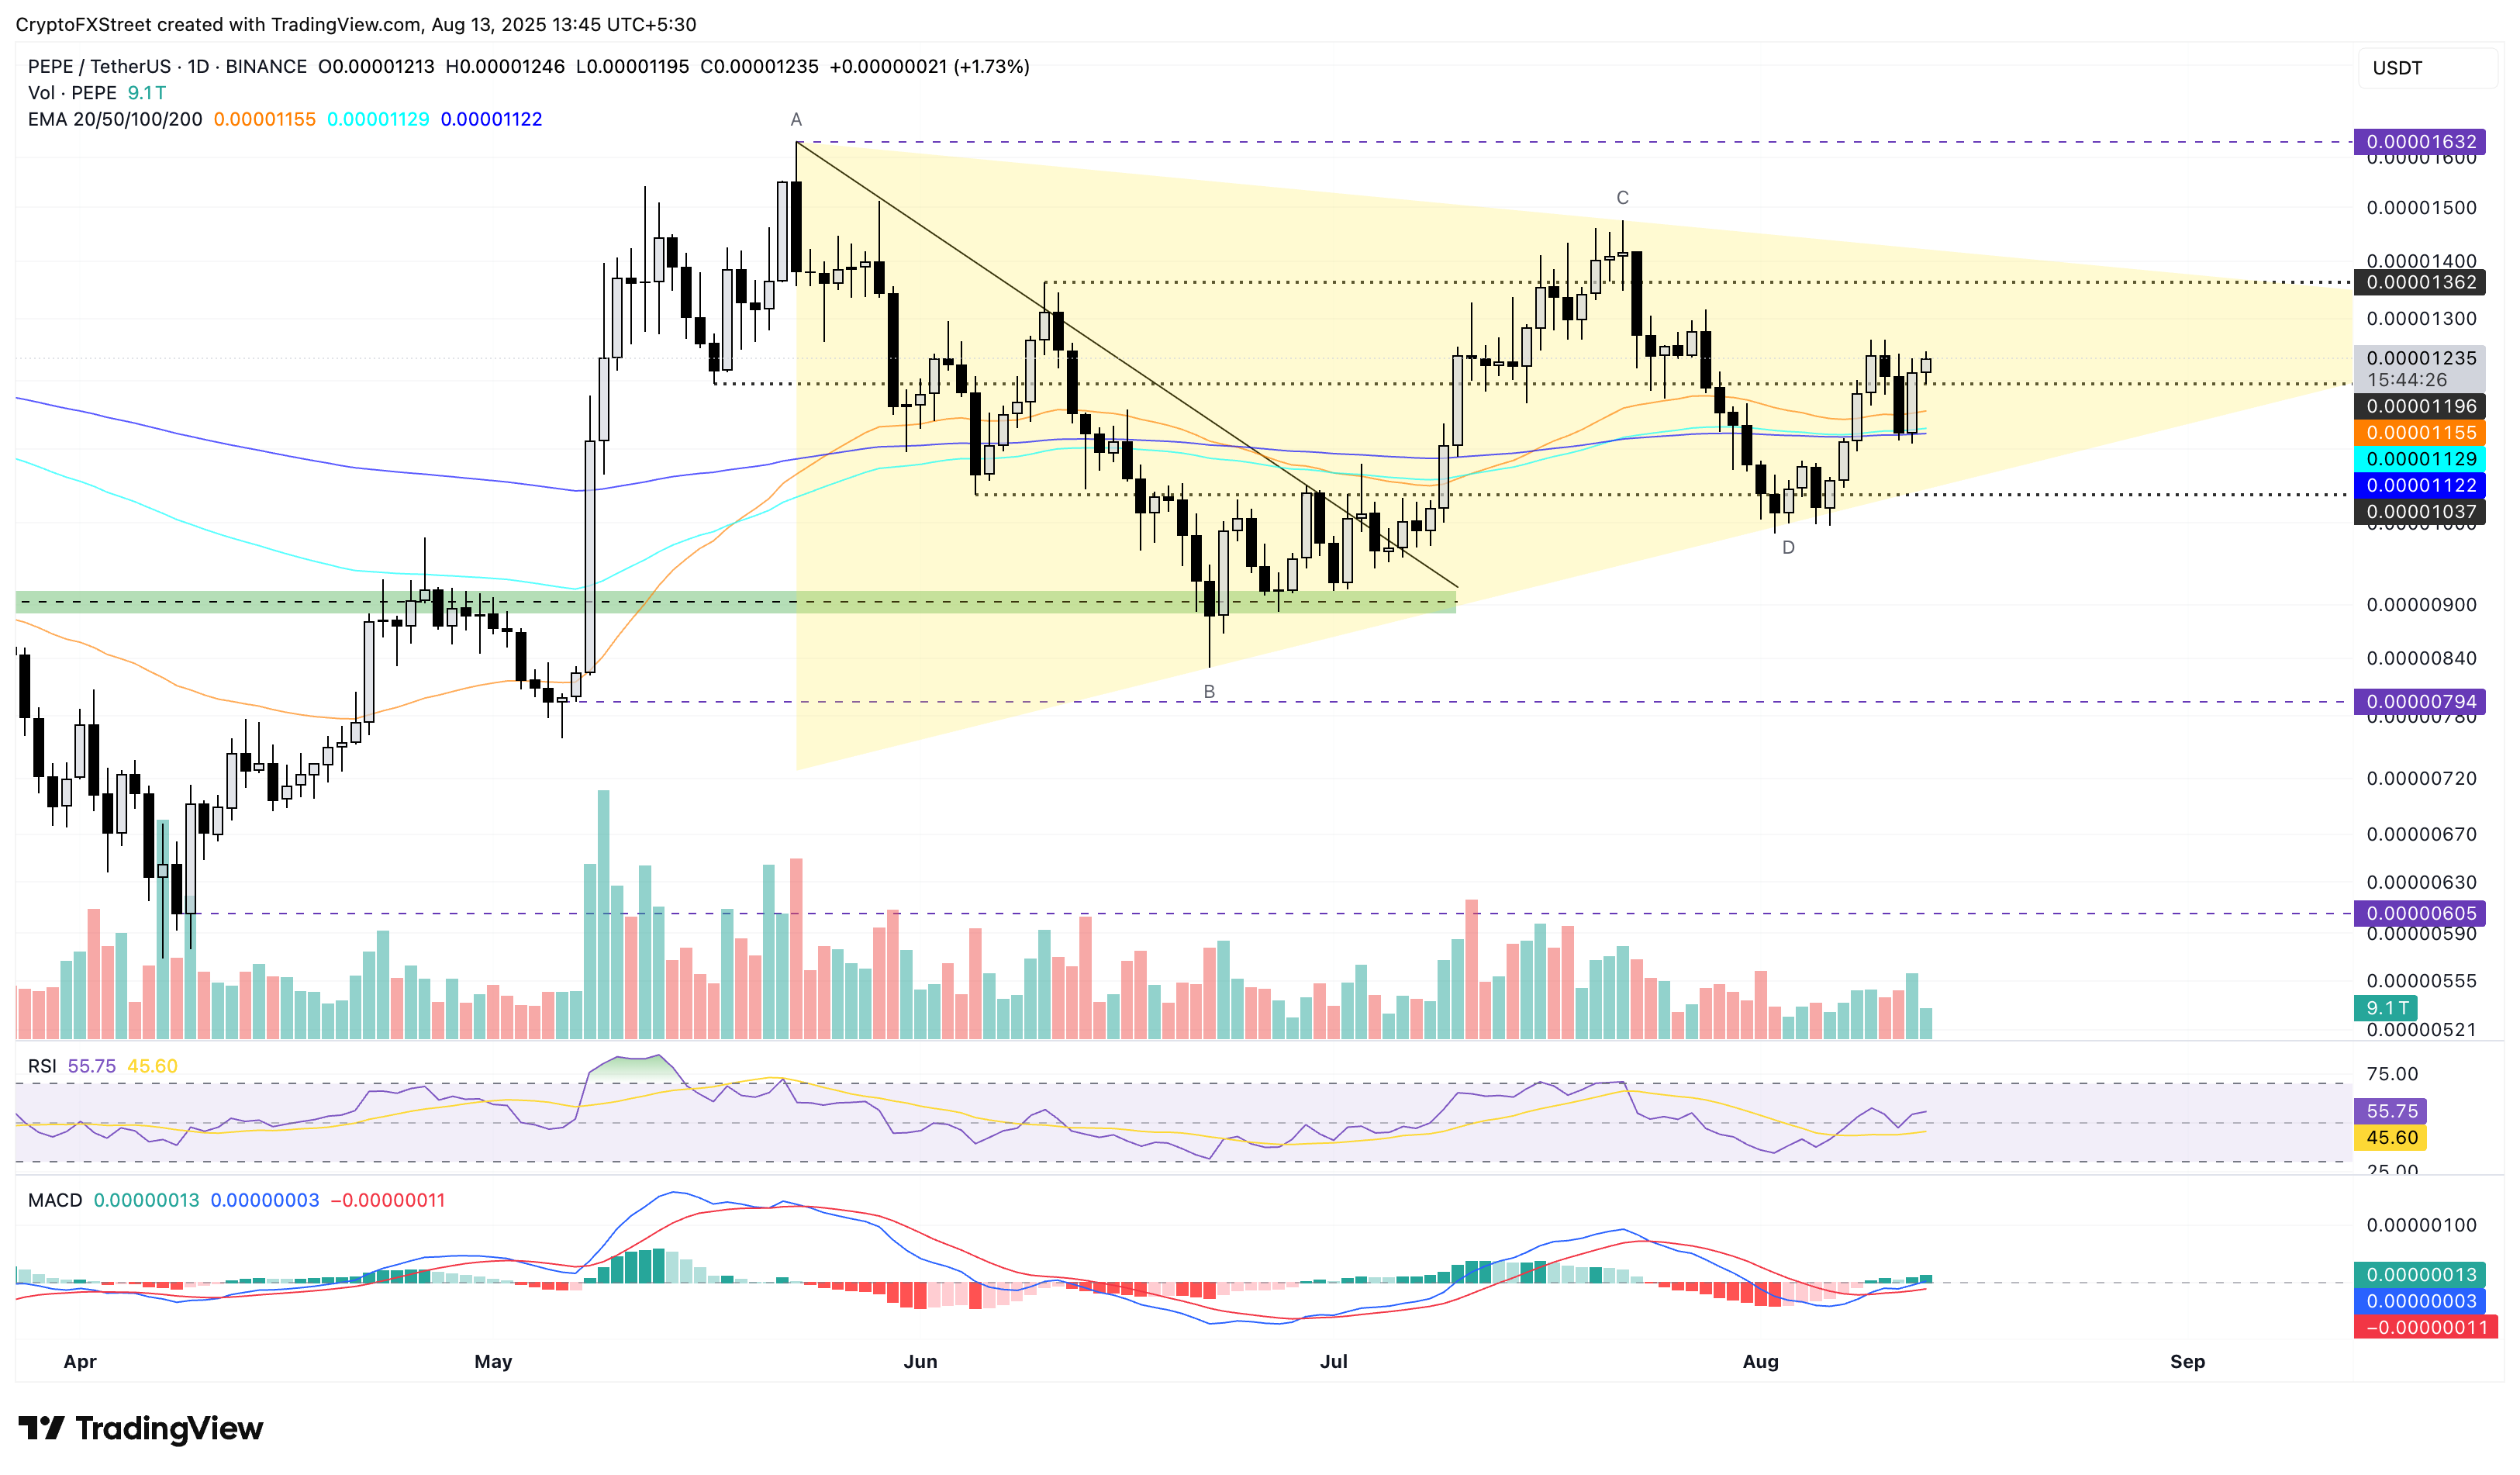
PEPE/USDT daily price chart.
On the contrary, a bearish close to the day could extend the decline in the meme coin to the 200-day EMA at $0.00001122.
Author

Vishal Dixit
FXStreet
Vishal Dixit holds a B.Sc. in Chemistry from Wilson College but found his true calling in the world of crypto.




