Litecoin technical analysis: LTC/USD is sitting just above critical support of a flag structure to the downside
- Litecoin price on Monday is trading in positive territory by 0.70% in the second half of the session.
- LTC/USD continues to move within a bearish flag structure, as the price sits just above the lower acting trend line.
- Litecoin versus is peers is somewhat outperforming, as the market is generally trading in the red.

Spot rate: 75.15
Relative change: +0.70%
High: 74.19
Low: 71.65
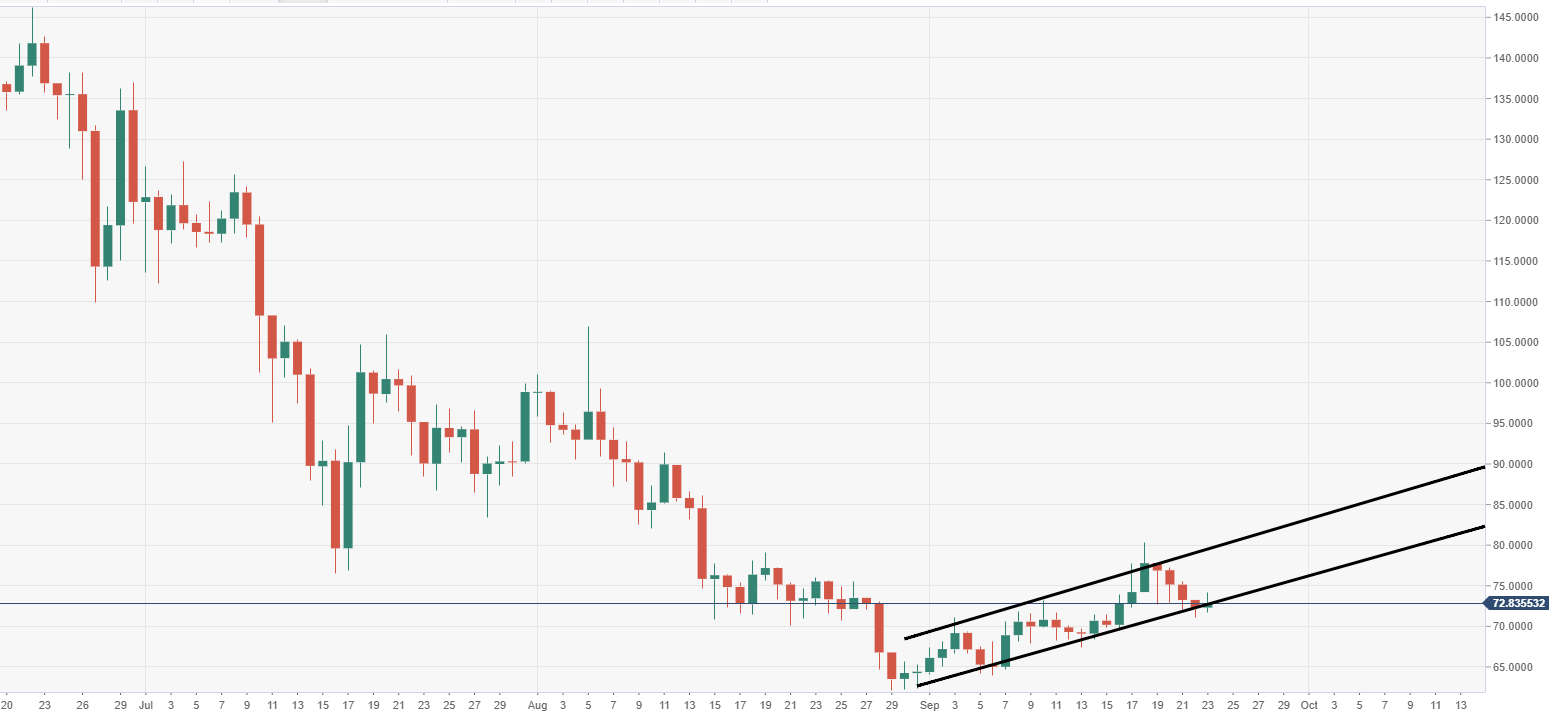
LTC/USD daily chart
- Price action via the daily chart view is moving within a bearish flag structure, subject to a potential breach.
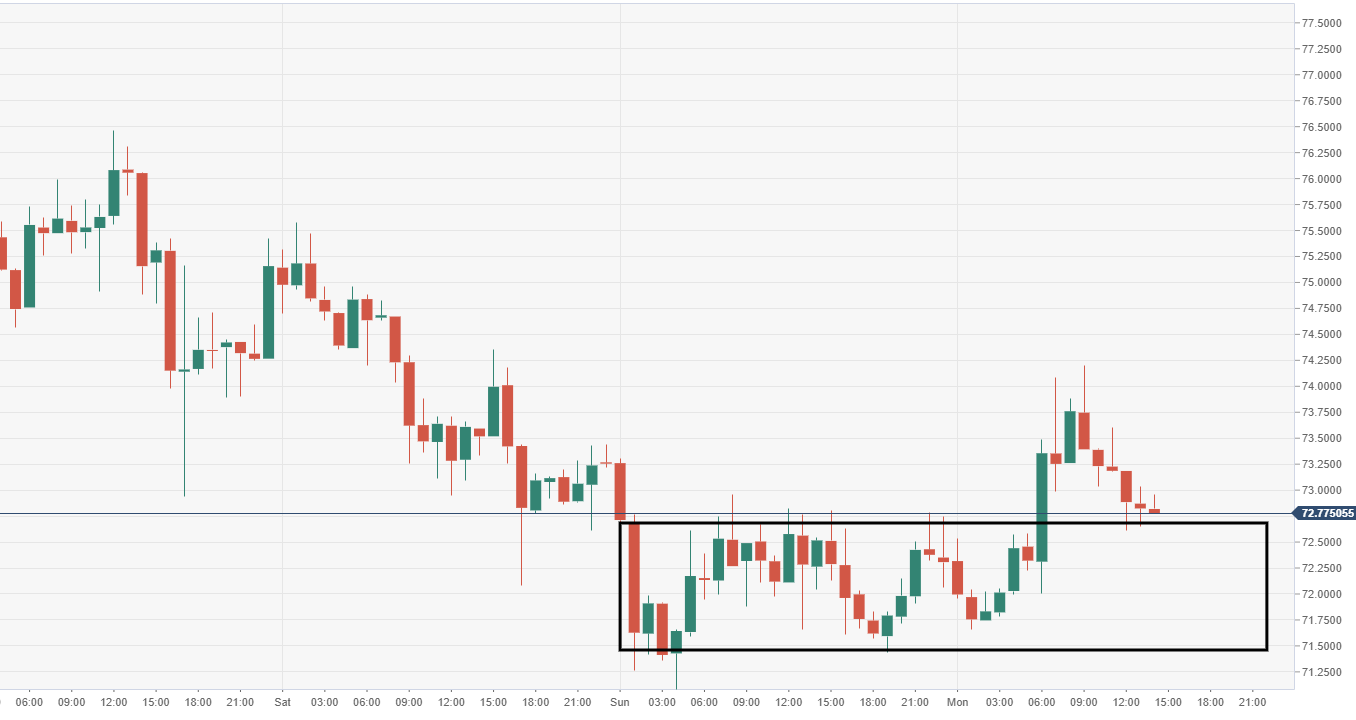
LTC/USD 60-minute chart
- LTC/USD via the 60-minute chart view is heading back for a retest of a breached range, $72.50-71.50.
Author

Ken Chigbo
Independent Analyst
Ken has over 8 years exposure to the financial markets. He started his career as an analyst, covering a variety of asset classes; forex, fixed income, commodities and equities.
More from Ken Chigbo


