Jupiter Price Prediction: JUP recovery gains traction as Securitize launches tokenized equities on DEX
- Jupiter surges by more than 8% on Tuesday as demand for its native token expands.
- Securitize has announced the launch of tokenized equities trading in collaboration with Jupiter and Jump.
- Momentum indicators strengthen JUP’s bullish outlook, with RSI lifting toward overbought territory.

Jupiter (JUP) edges up above $0.1900 at the time of writing on Tuesday, up from the daily low at $0.1820. The token native to the decentralized exchange (DEX) exhibits growing recovery signals, raising the odds of a short-term breakout above the immediate $0.2000 resistance level.
Securitize taps Jupiter and Jump for tokenized equities
Securitize, a real-world asset (RWA) tokenization company, has announced that it has joined forces with Jupiter and Jump to launch tokenized securities trading on the Solana (SOL) blockchain.
The collaboration builds on Securitize’s regulatory infrastructure, Jump’s liquidity through ProAMM on Solana, and Jupiter’s distribution for tokenized equities on a decentralized finance (DeFi) platform.
Securitize ensures reliable operation by powering execution in coordination with broker-dealers while providing transfer agent infrastructure and know-your-customer (KYC)-enabled wallets. This allows for the issuance of real equities, which are then accessed and traded on-chain and in an institutional-grade, regulated environment.
Xiao-Xiao, Jupiter’s President, stated that “by making tokenized equities accessible through Jupiter, we’re able to bring these assets to millions of people around the world and push tokenization from a proof-of-concept to a scalable solution.”
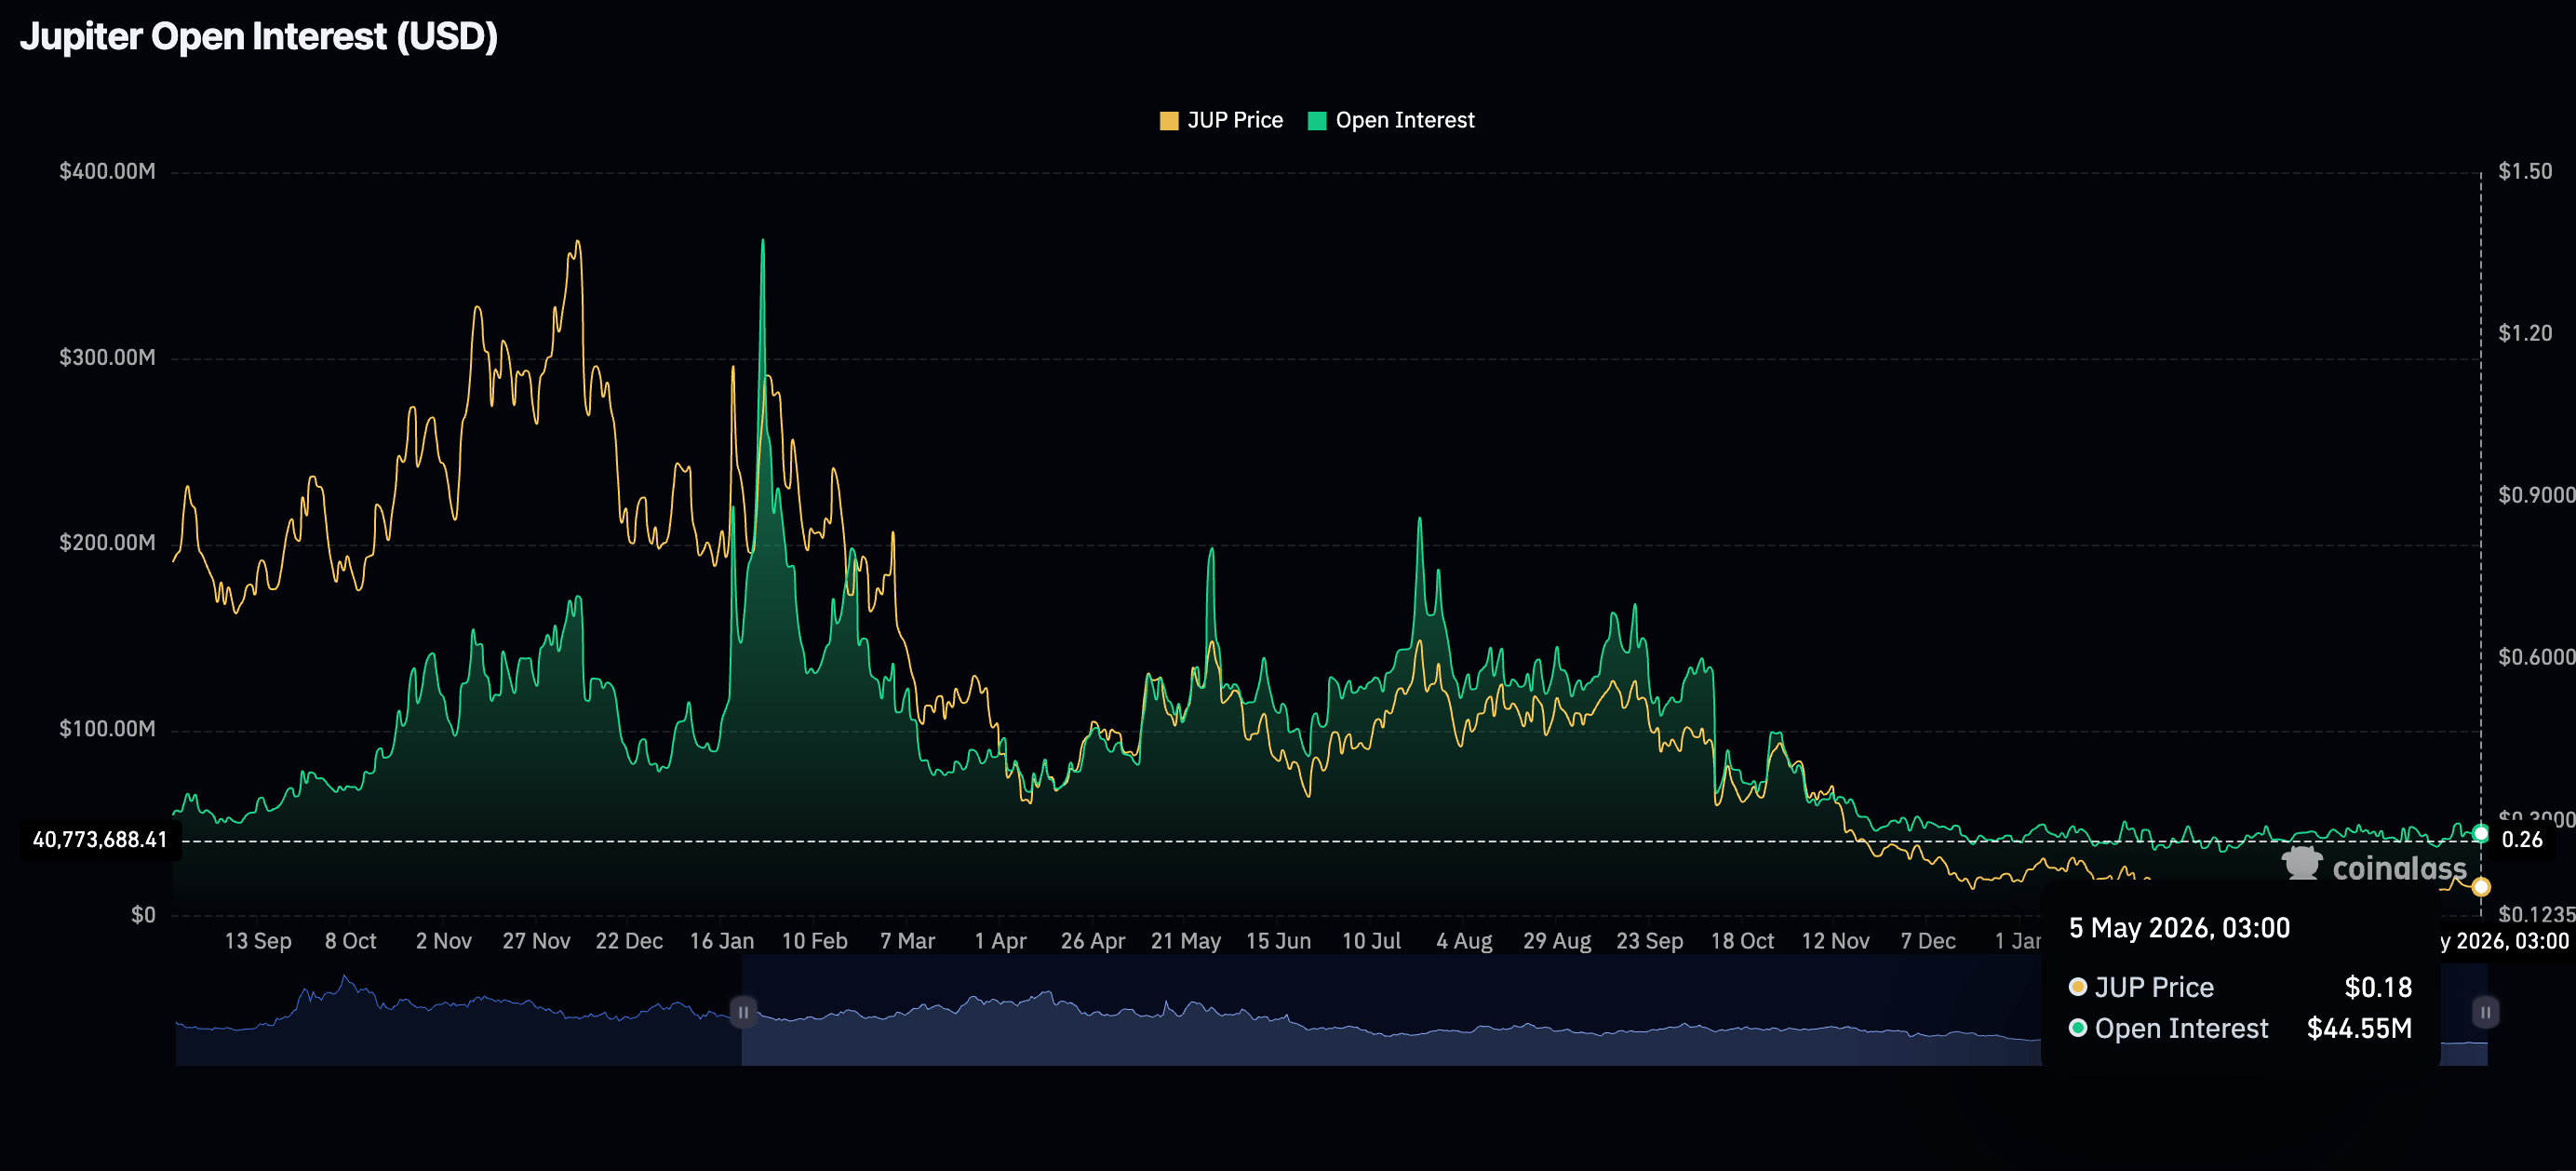
Turning to JUP derivatives, retail interest remains significantly suppressed, as reflected in the perpetual futures' Open Interest (OI), which has steadied at $45 million since Friday.
Conversely, OI surged to $364 million in January 2025, mirroring an 80% price surge to $1.28 from a monthly low of $0.71. This highlights the pivotal role of retail participation in driving and maintaining upward price momentum.
Technical outlook: Jupiter renews bullish momentum
Jupiter trades at $0.1918, extending a constructive bias after reclaiming the former downward resistance trendline around $0.1797 and holding above the 50- and 100-day Exponential Moving Averages (EMAs) at $0.1727 and $0.1817, respectively. This positioning suggests buyers remain in control while the Relative Strength Index (RSI) is near 63 on the daily chart, signaling firm but not yet overbought momentum.
Meanwhile, the flatlining Moving Average Convergence Divergence (MACD) line around zero on the same chart hints at a nascent bullish phase rather than an exhausted move.
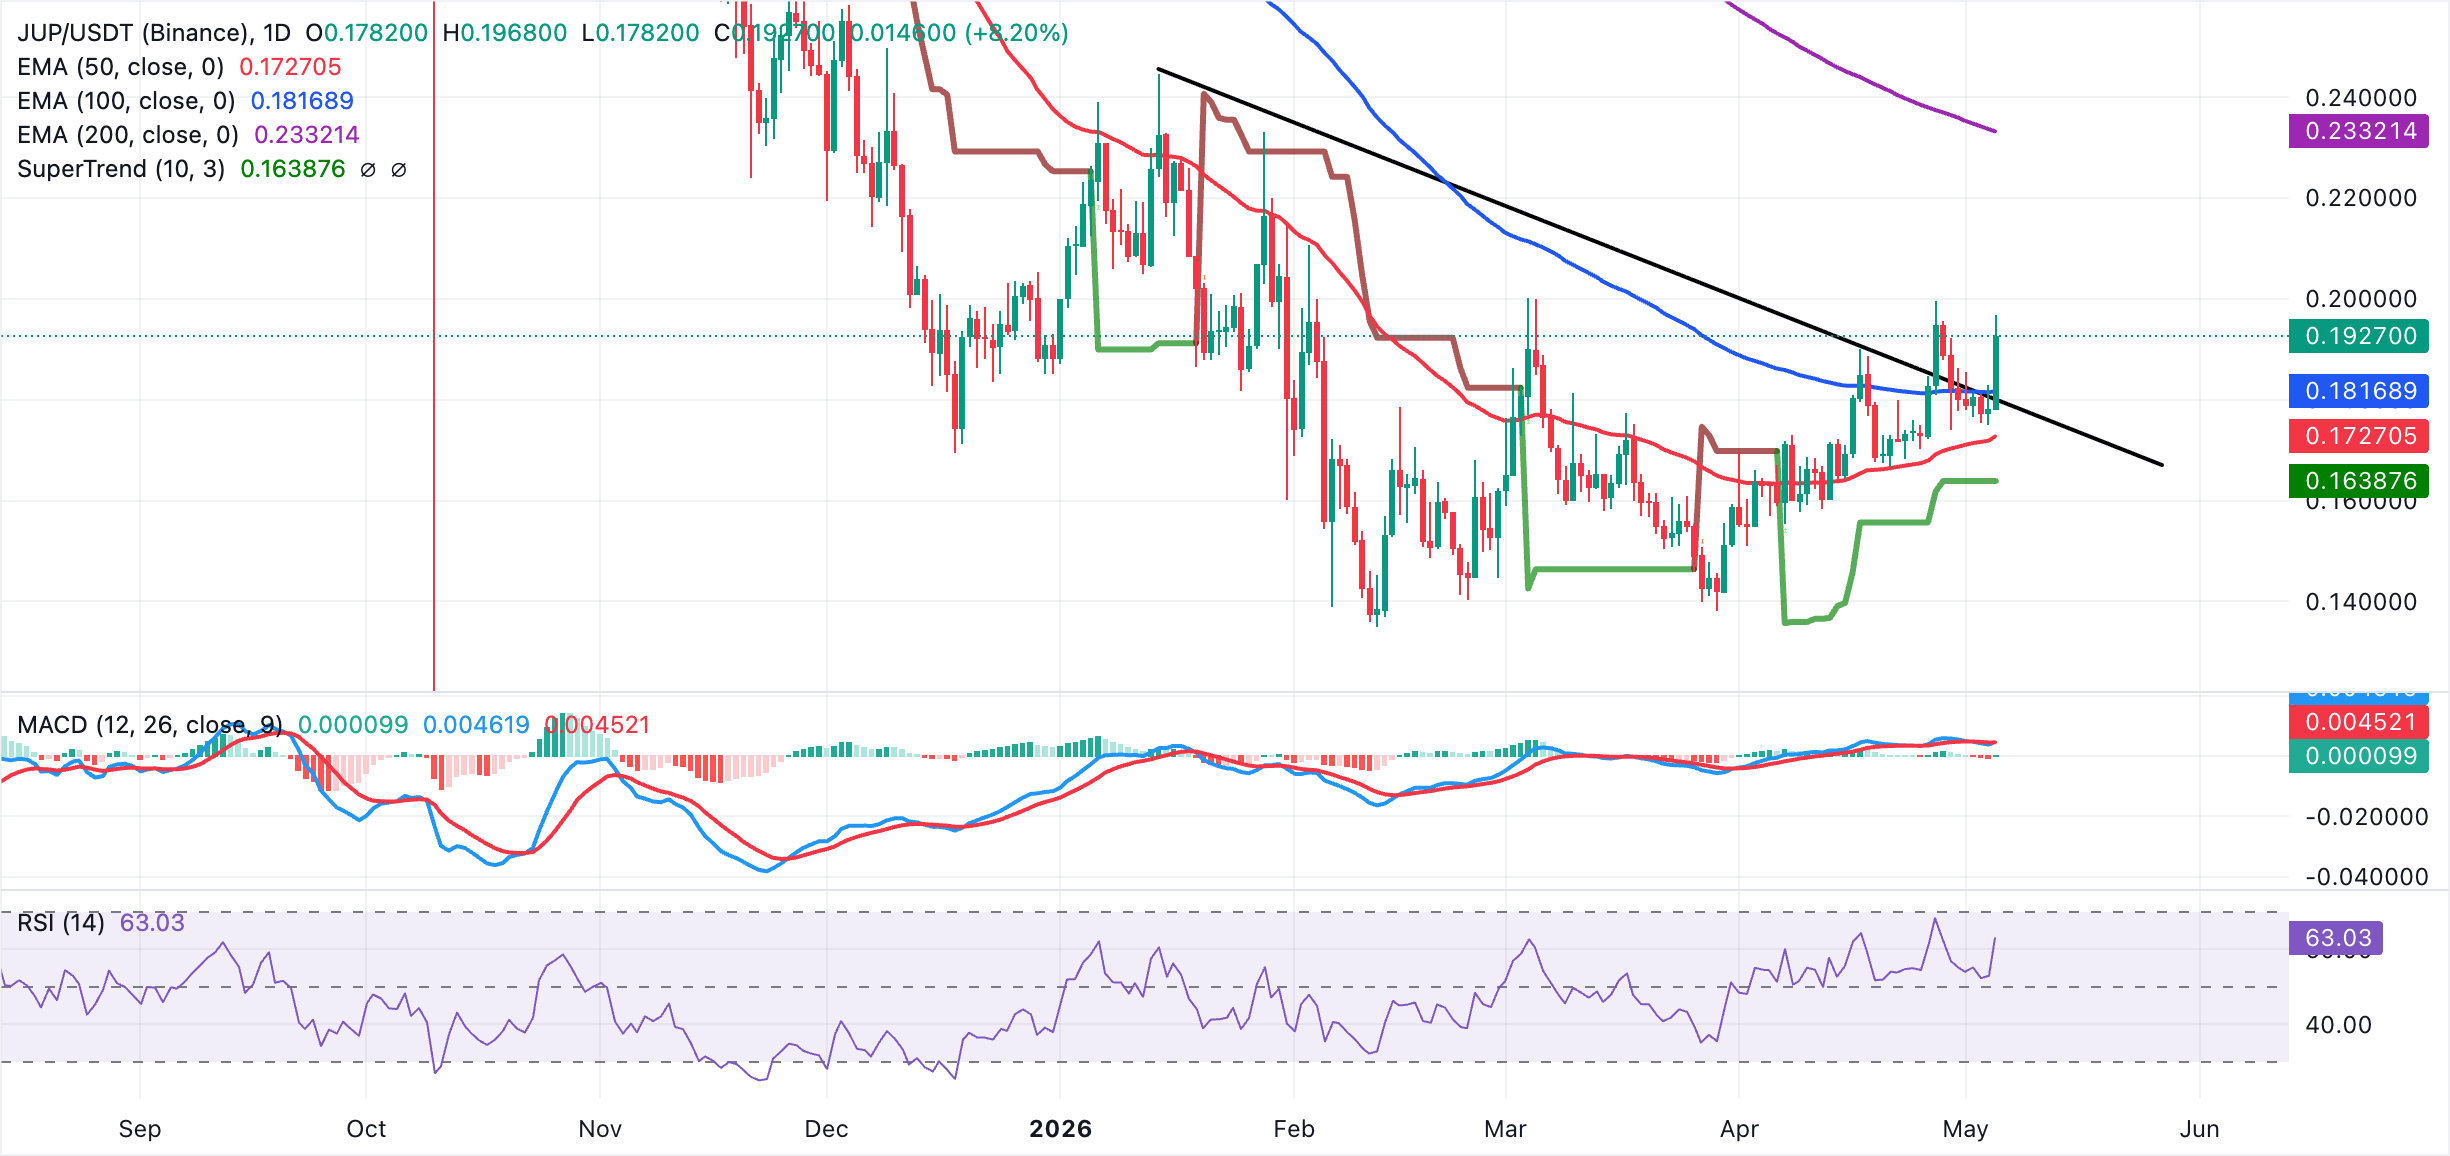
On the downside, initial support is seen at the recent breakout and close area near $0.1918, with additional demand expected at the 100-day EMA around $0.1817 and the prior trendline break level at $0.1797, while deeper pullbacks may look toward the 50-day EMA and the SuperTrend baseline at $0.1727 and $0.1639.
On the topside, the next notable barrier is the supply at $0.2000, followed by the 200-day EMA near $0.2332, which now stands as the primary medium-term resistance that bulls would need to clear to unlock a more sustained upside extension.
(The technical analysis of this story was written with the help of an AI tool.)
Open Interest, funding rate FAQs
Higher Open Interest is associated with higher liquidity and new capital inflow to the market. This is considered the equivalent of increase in efficiency and the ongoing trend continues. When Open Interest decreases, it is considered a sign of liquidation in the market, investors are leaving and the overall demand for an asset is on a decline, fueling a bearish sentiment among investors.
Funding fees bridge the difference between spot prices and prices of futures contracts of an asset by increasing liquidation risks faced by traders. A consistently high and positive funding rate implies there is a bullish sentiment among market participants and there is an expectation of a price hike. A consistently negative funding rate for an asset implies a bearish sentiment, indicating that traders expect the cryptocurrency’s price to fall and a bearish trend reversal is likely to occur.
Author

John Isige
FXStreet
John Isige is a seasoned cryptocurrency journalist and markets analyst committed to delivering high-quality, actionable insights tailored to traders, investors, and crypto enthusiasts. He enjoys deep dives into emerging Web3 tren




