Iota price analysis: IOT/USD peaks above the 20-day Bollinger Band
- Iota is currently trending in an upwards channel formation.
- The latest price session has gone up from $0.262 to $0.268.

Iota has managed to have six straight bullish days and is trending in an upwards channel formation. The latest price session has gone up from $0.262 to $0.268. The hourly breakdown shows that this Tuesday, the price had gone up to $0.264, where it met resistance and trended horizontally. The bears then stepped in and dropped the price to $0.261 as Tuesday came to a close. The bulls have since started the day strong and managed to take the price up to $0.268.
IOT/USD daily chart
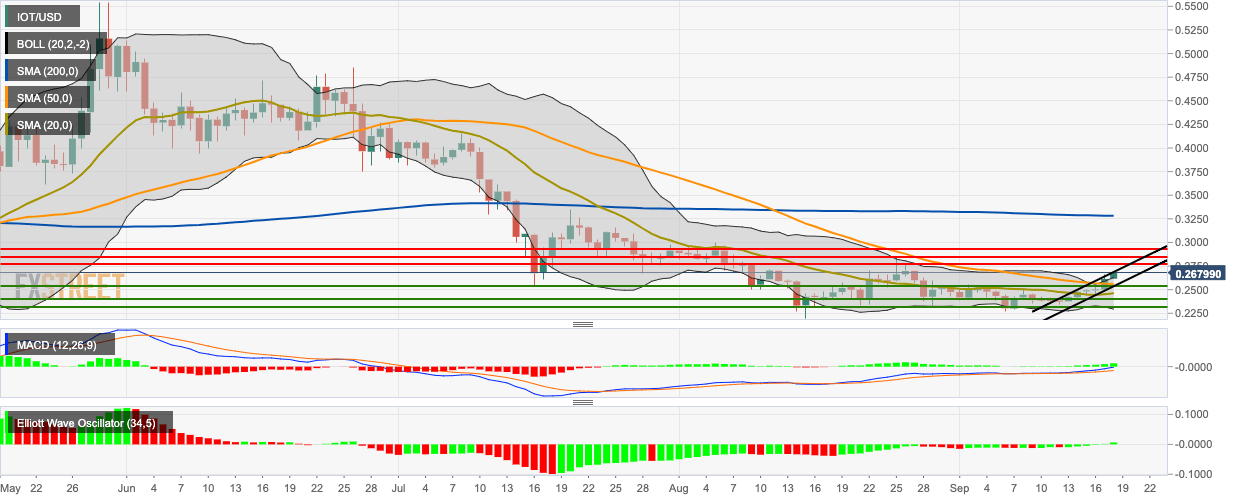
The two latest sessions have taken the price of Iota above the 20-day Bollinger band, indicating that the asset is overpriced and may face bearish correction soon. IOT/USD is also trending above the 20-day Simple Moving Average (SMA 20) and SMA 50 curves. The Moving Average Convergence/Divergence (MACD) indicator shows increasing bullish momentum, while the Elliott Oscillator shows six straight bullish sessions of growing intensity.
Author

Rajarshi Mitra
Independent Analyst
Rajarshi entered the blockchain space in 2016. He is a blockchain researcher who has worked for Blockgeeks and has done research work for several ICOs. He gets regularly invited to give talks on the blockchain technology and cryptocurrencies.


