Hyperliquid Price Forecast: HYPE regains strength with $70 million in ETF inflows
- Hyperliquid is up over 3% so far on Tuesday, approaching the $70 mark after six straight days of recovery.
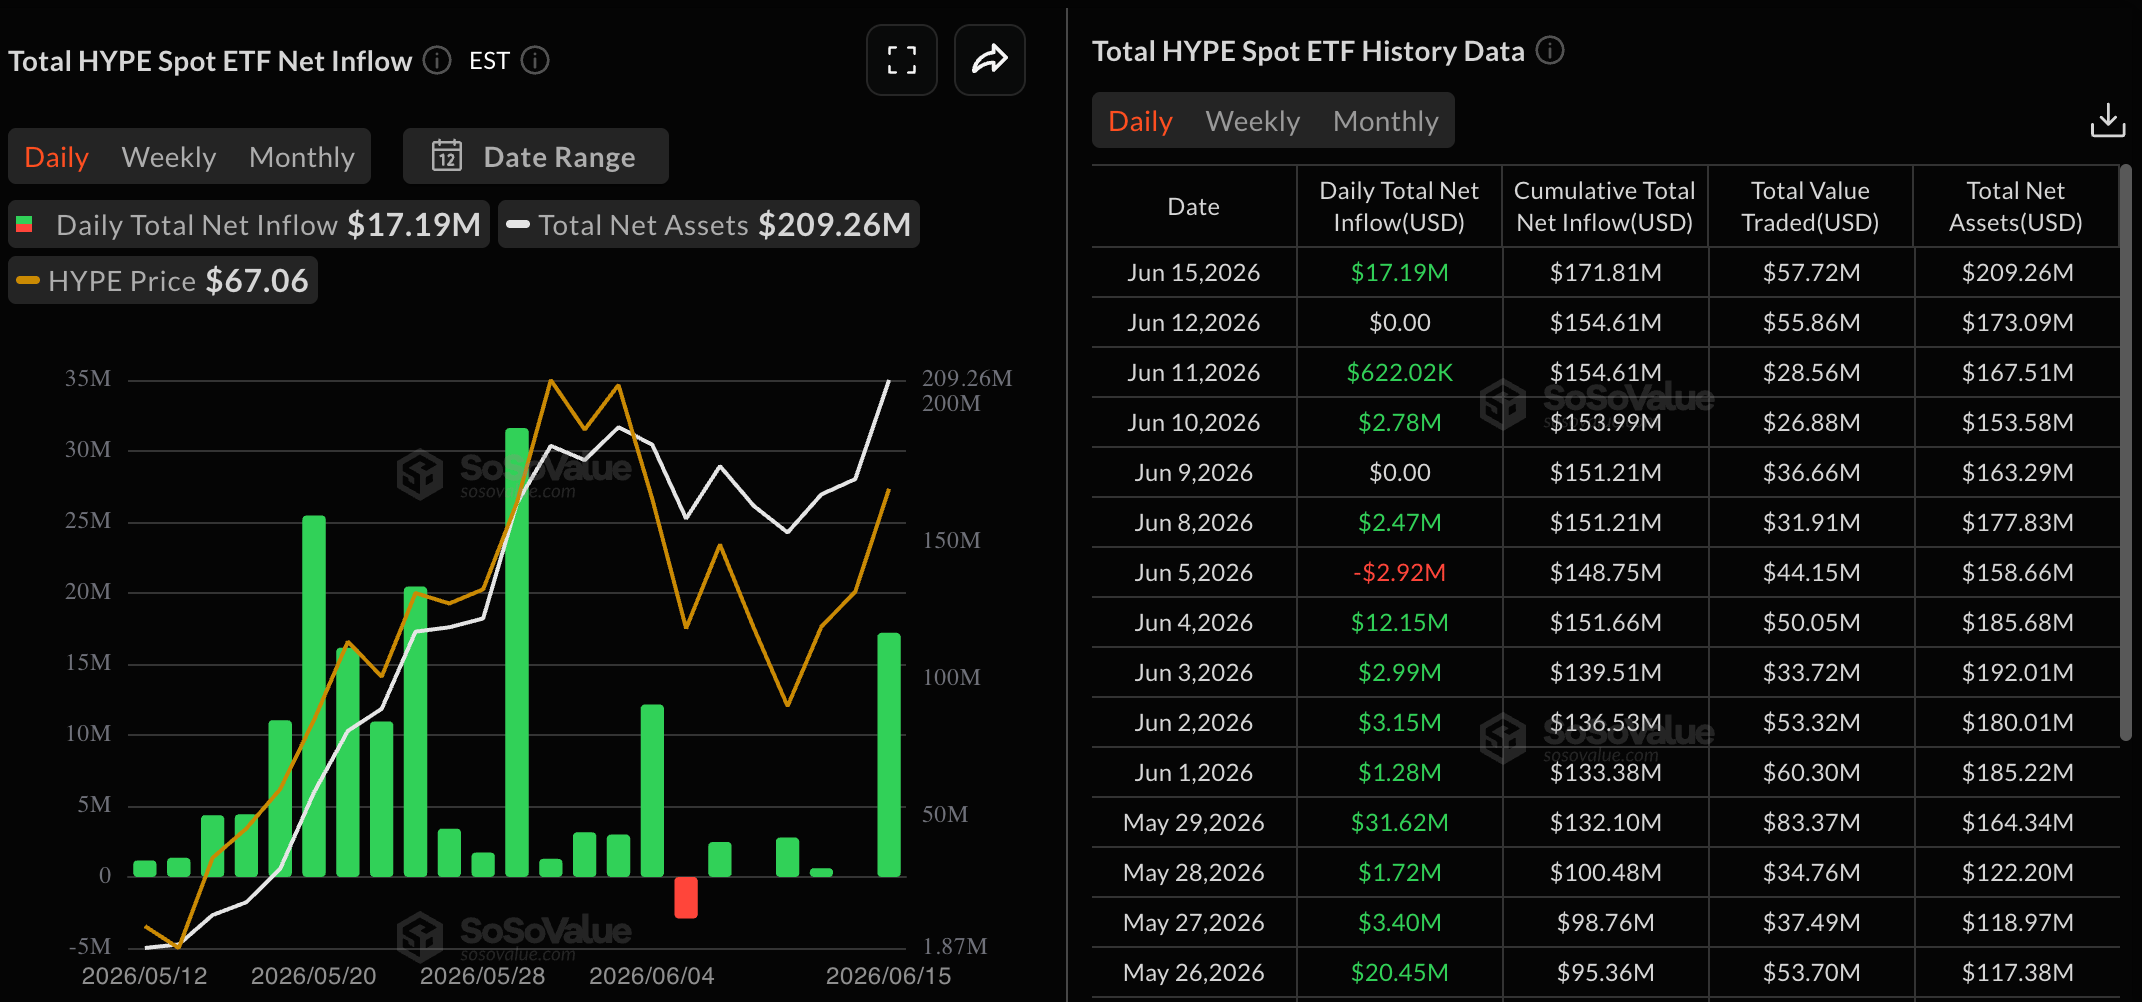
- Institutional demand for HYPE spikes higher with $17.19 million in inflows on Monday, the highest since May 29.
- The technical outlook for HYPE is bullish, suggesting a fresh phase of price discovery with a decisive close above $75.

Hyperliquid (HYPE) extends a steady upward trend on Tuesday for the sixth consecutive day, approaching its $70 mark. Recurring inflow spikes in HYPE-focused Exchange Traded Funds (ETFs) reflect consistent institutional demand for the everything exchange token.
The technical outlook for HYPE suggests further upside as bullish momentum recovers, with a move above the $75.76 record high set on June 1.
Hyperliquid retains its hype among institutions
Hyperliquid suffered a minor correction earlier this month following the exit of Arthur Hayes, which aligned with eased institutional interest. However, a fresh $17.19 million spike in inflows across HYPE-focused ETFs on Monday reflects renewed demand, the largest inflow since May 29. The total net assets held by HYPE ETFs rose to $209.26 million on Monday, from $173.09 million on Friday.
Hyperliquid’s new record of $3 billion in Real-World Asset (RWA) Open Interest on its HIP-3 reflects a steady shift in demand from traditional markets toward the decentralized platform. HIP-3 has set a new record in Open Interest every month since its launch in October 2025, fueling the institutional interest.
Technical outlook: Will HYPE cross above $75?
Hyperliquid hovers near $70, maintaining a constructive bullish bias as price holds well above the 50-day, 100-day, and 200-day Exponential Moving Averages (EMAs), which cluster between roughly $42.80 and $55.70. From a technical perspective, the V-shaped rebound in HYPE from $53.00, near last week's 50-day EMA, suggests that recent dips have been bought into, reinforcing a medium-term uptrend.
That said, the Relative Strength Index (RSI) is near 60 on the daily chart, indicating positive yet not overextended momentum, while the Moving Average Convergence Divergence (MACD) line is close to crossing above its signal line, with sharply contracting negative histograms, hinting that upside pressure is resurfacing.
On the topside, initial resistance is defined by the June 1 high at $75.76, followed by the 127.2% and 161.8% Fibonacci extension levels at about $83.63 and $94.83, respectively, measured over the $75.76 to $52.67 downswing earlier this month.
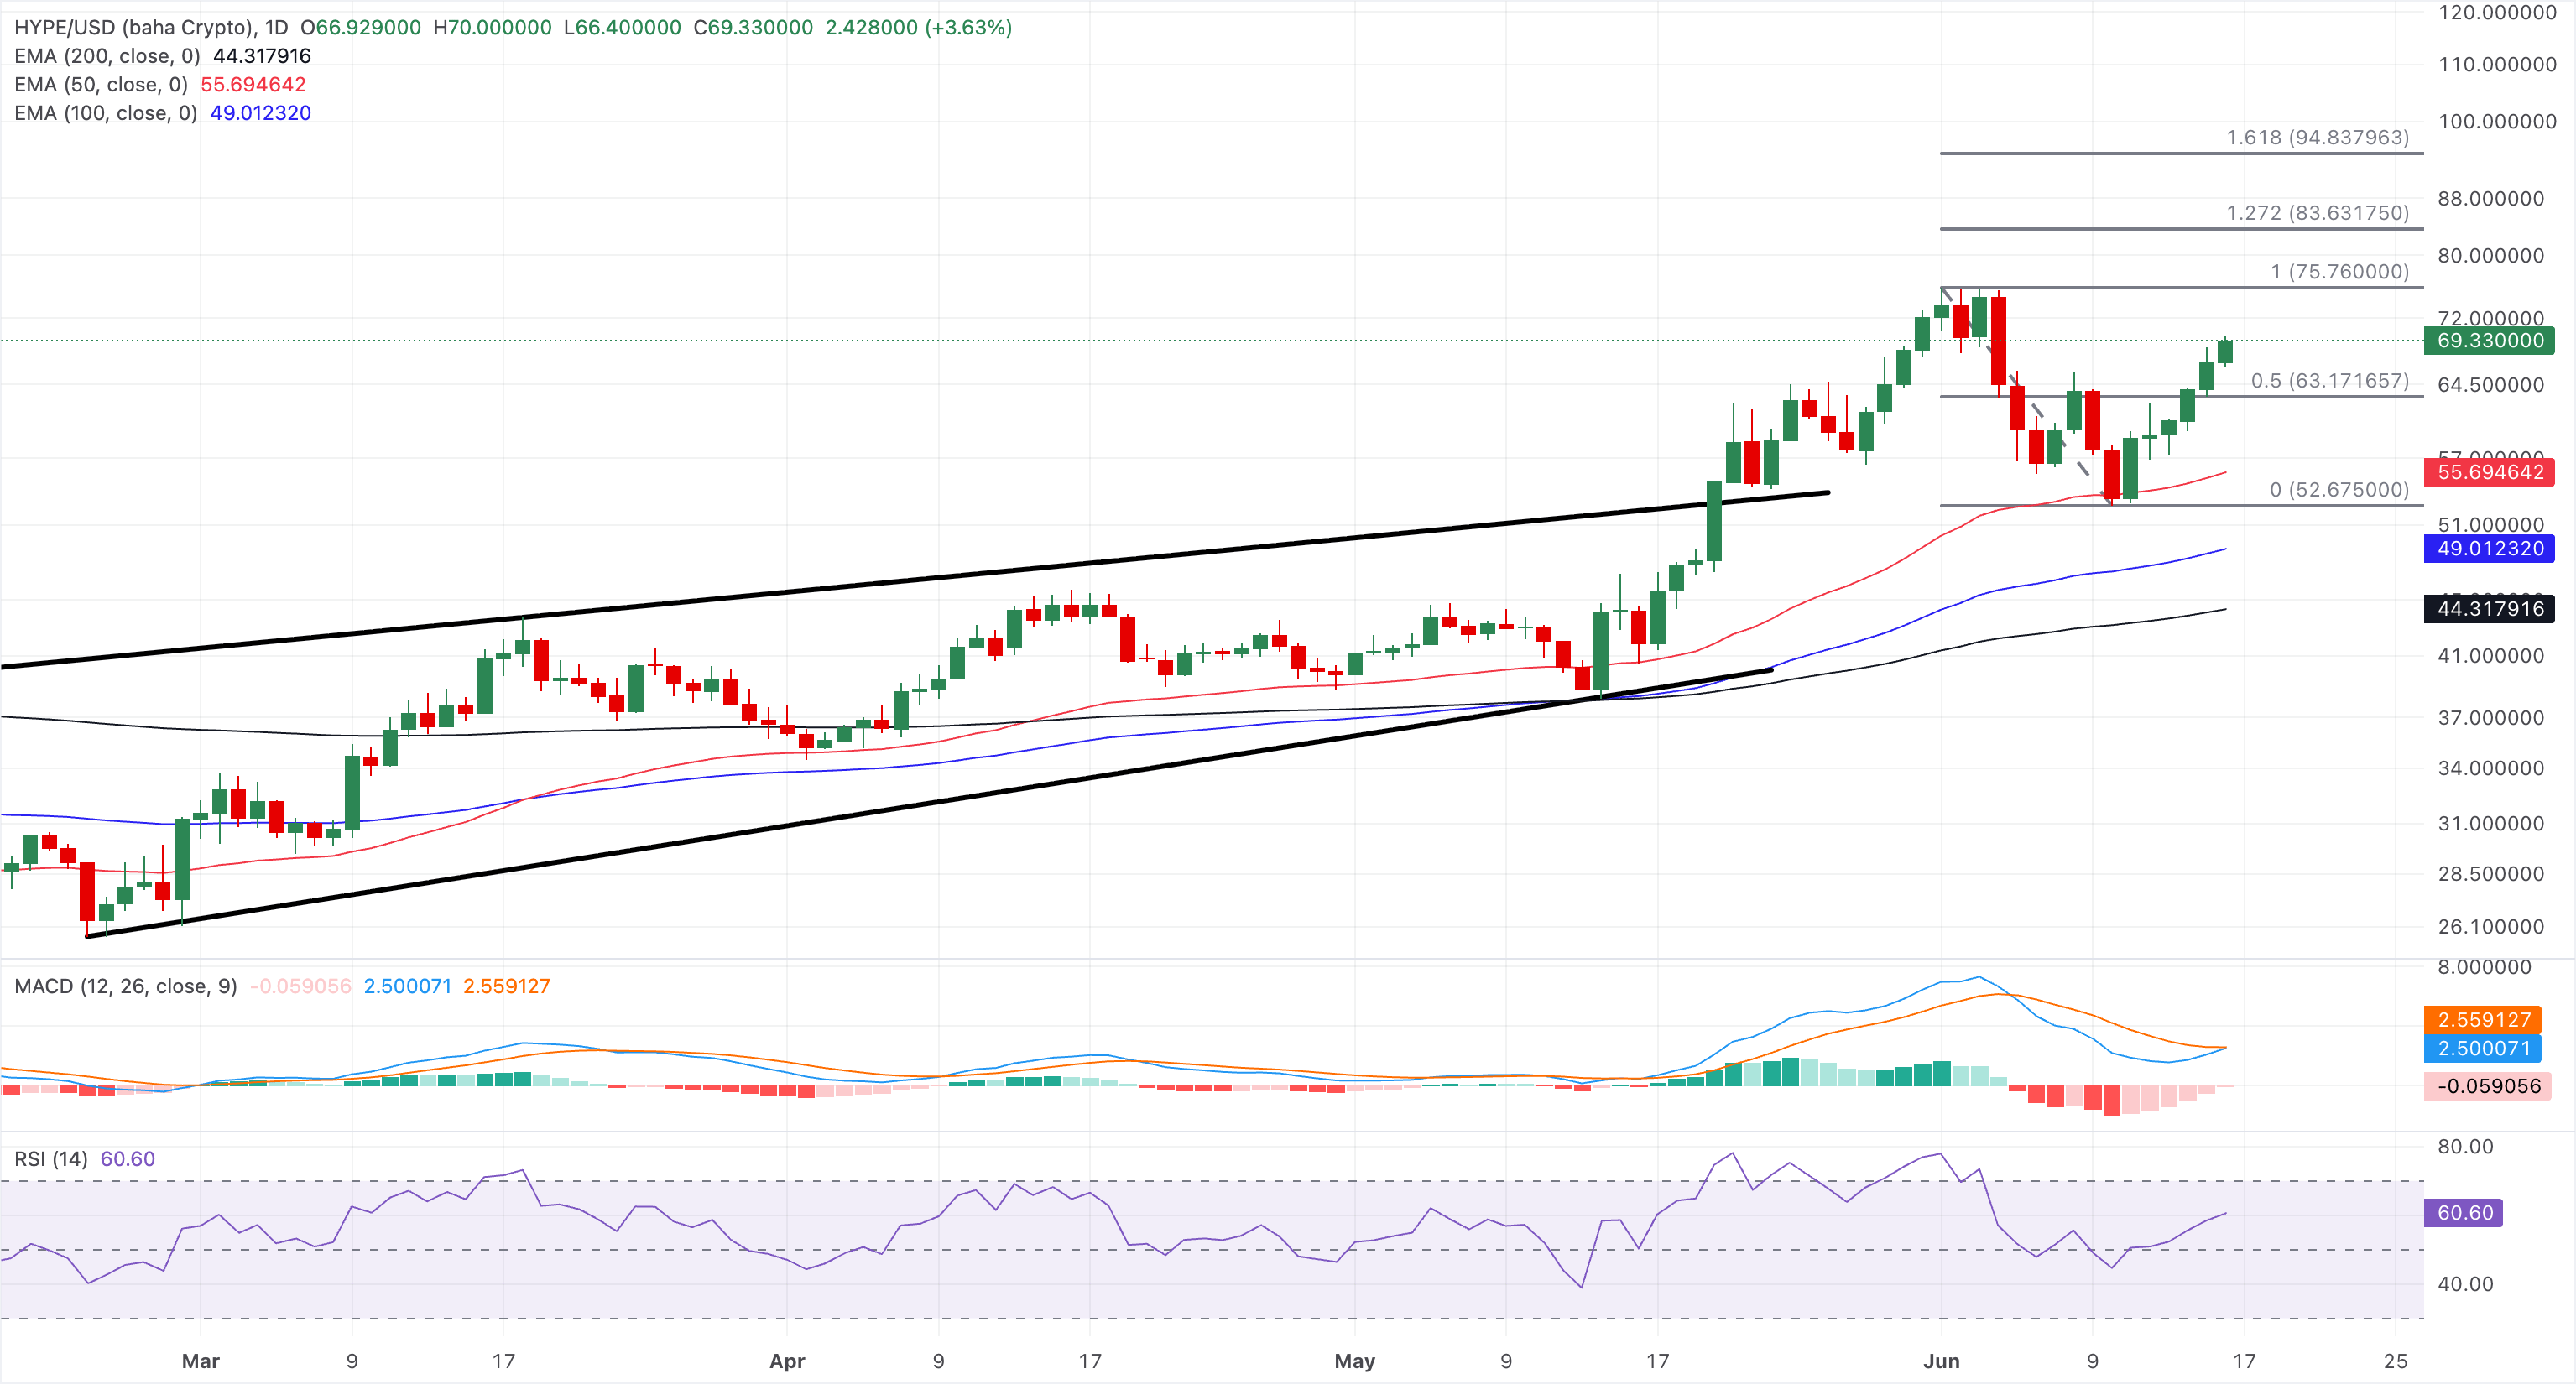
On the downside, the 50% retracement at $63.17 marks the first notable support, followed by the 50-day EMA at $55.69.
(The technical analysis of this story was written with the help of an AI tool.)
Cryptocurrency metrics FAQs
The developer or creator of each cryptocurrency decides on the total number of tokens that can be minted or issued. Only a certain number of these assets can be minted by mining, staking or other mechanisms. This is defined by the algorithm of the underlying blockchain technology. On the other hand, circulating supply can also be decreased via actions such as burning tokens, or mistakenly sending assets to addresses of other incompatible blockchains.
Market capitalization is the result of multiplying the circulating supply of a certain asset by the asset’s current market value.
Trading volume refers to the total number of tokens for a specific asset that has been transacted or exchanged between buyers and sellers within set trading hours, for example, 24 hours. It is used to gauge market sentiment, this metric combines all volumes on centralized exchanges and decentralized exchanges. Increasing trading volume often denotes the demand for a certain asset as more people are buying and selling the cryptocurrency.
Funding rates are a concept designed to encourage traders to take positions and ensure perpetual contract prices match spot markets. It defines a mechanism by exchanges to ensure that future prices and index prices periodic payments regularly converge. When the funding rate is positive, the price of the perpetual contract is higher than the mark price. This means traders who are bullish and have opened long positions pay traders who are in short positions. On the other hand, a negative funding rate means perpetual prices are below the mark price, and hence traders with short positions pay traders who have opened long positions.
Author

Vishal Dixit
FXStreet
Vishal Dixit holds a B.Sc. in Chemistry from Wilson College but found his true calling in the world of crypto.


