Zcash Price Forecast: ZEC risks over 15% drawdown amid declining shielded supply
- Zcash is down over 2% on Friday, testing a bearish breakout of a rising support trendline.
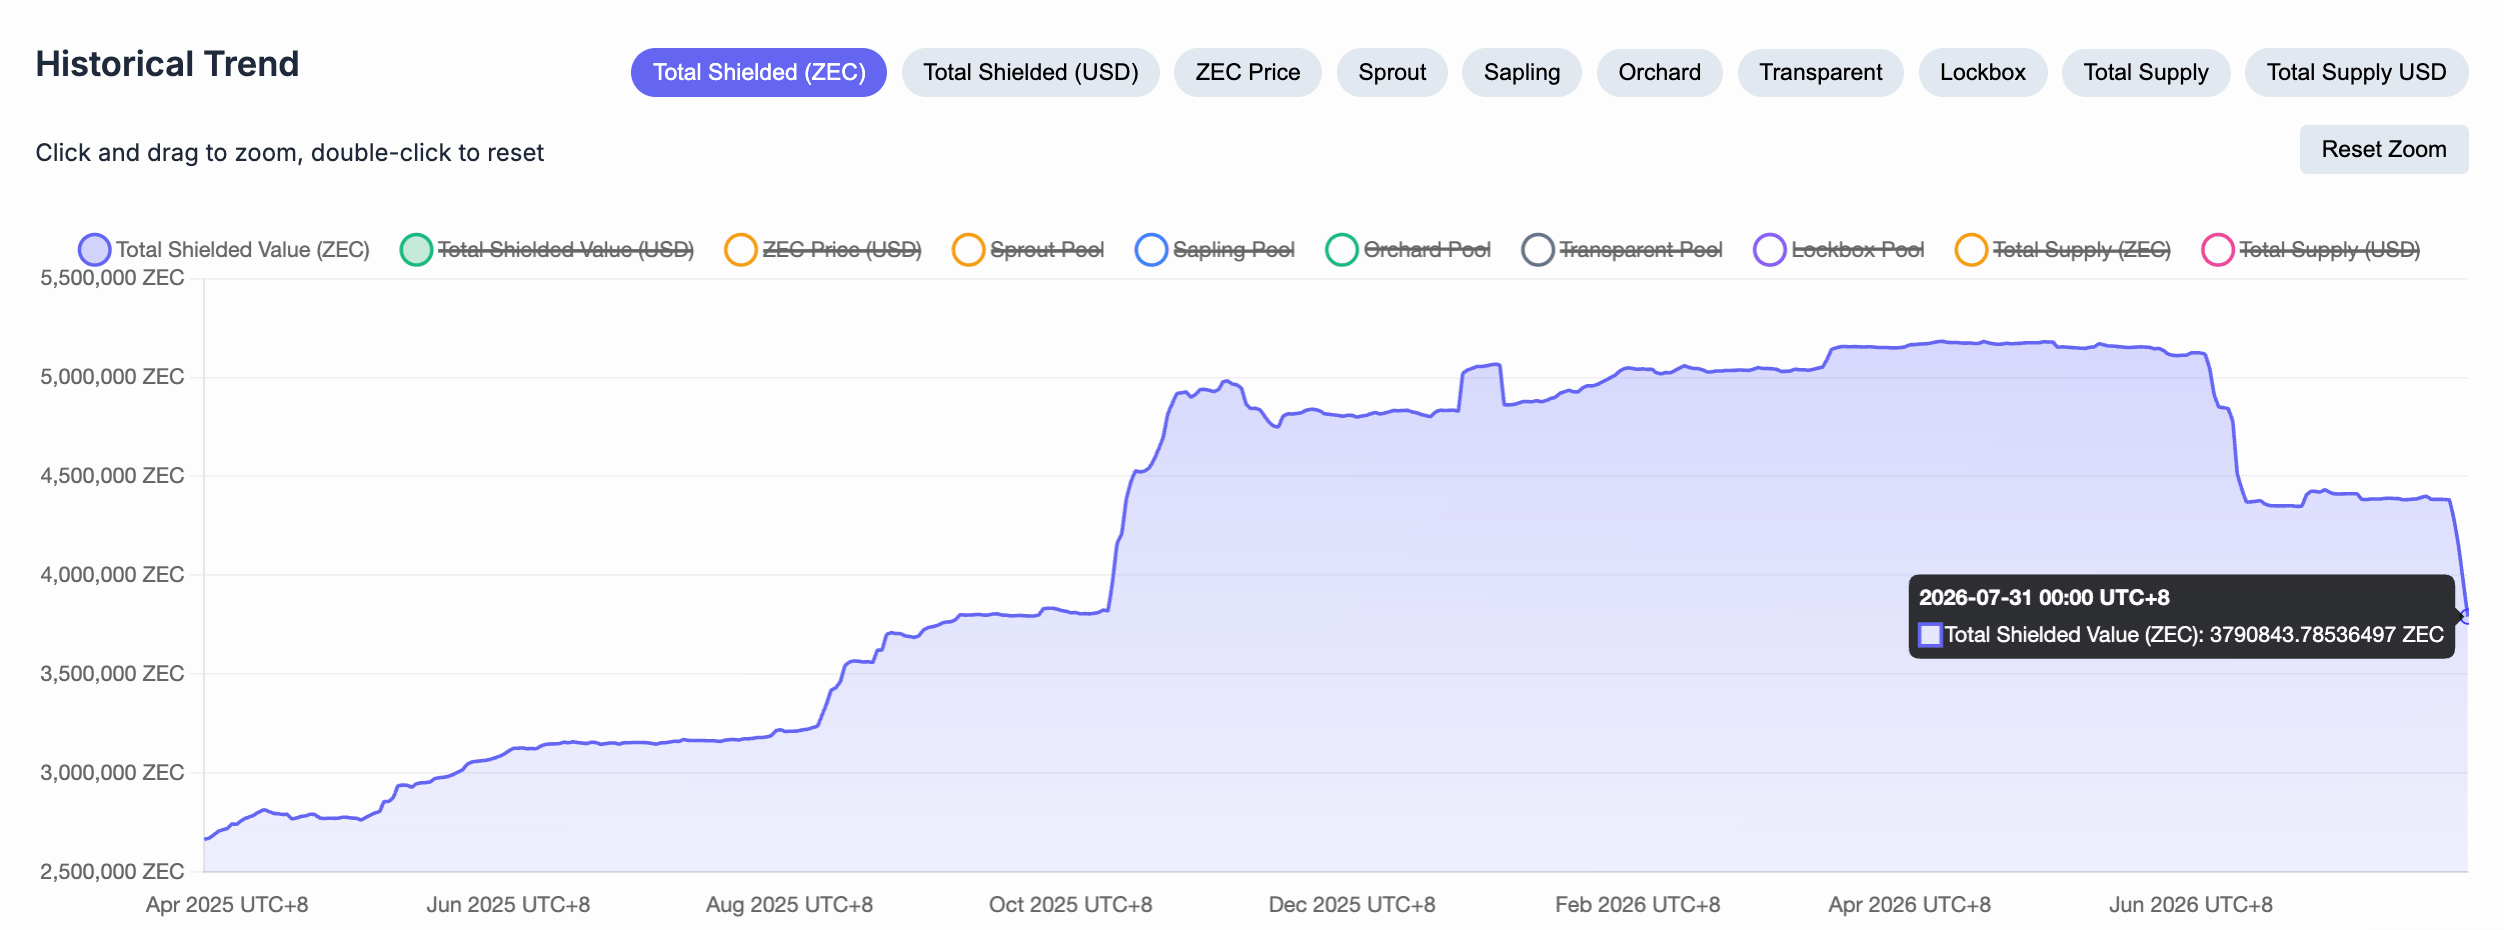
- Zcash adoption continues to weaken, with shielded supply down to a 10-month low of 3.79 million ZEC.
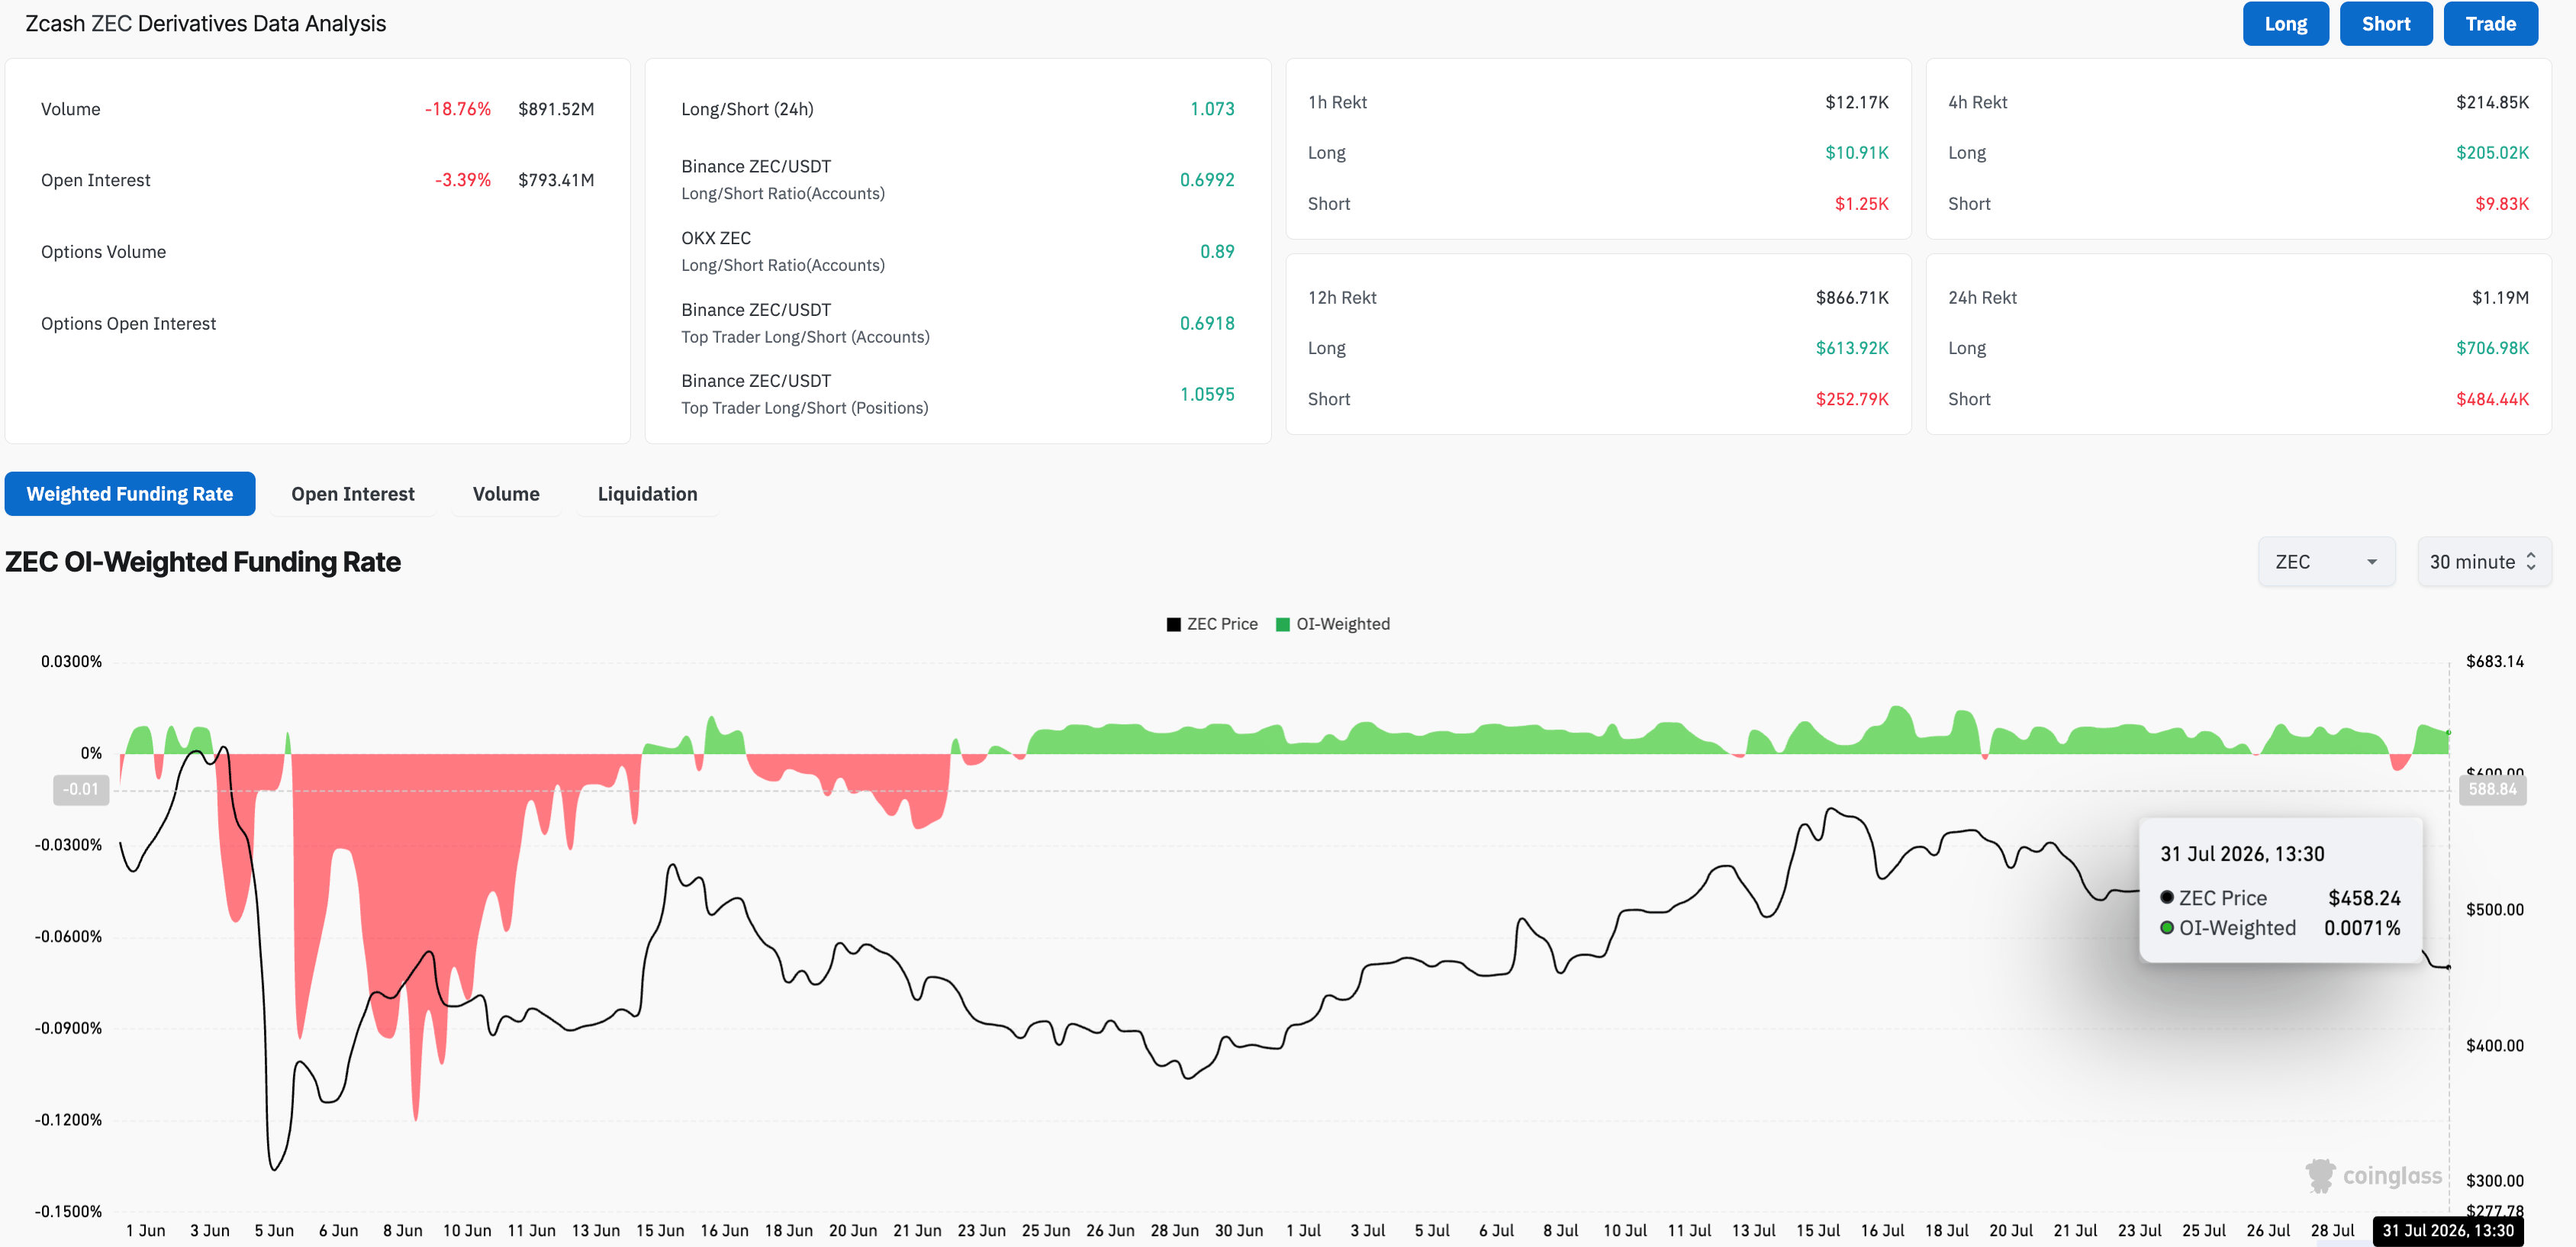
- Retail interest in Zcash wanes, with Open Interest down over 3% and funding rates easing.

Zcash (ZEC) is trading in the red on Friday, extending a roughly 20% decline over nearly two weeks. The privacy coin is losing adoption and retail demand, with shielded ZEC supply at a 10-month low and ZEC futures Open Interest down over 3% in 24 hours. The technical outlook for ZEC is mildly bearish as bullish momentum declines.
Declining adoption and retail support weigh on Zcash
The total supply of shielded ZEC tokens reflects the total number of tokens stored in Zcash’s cryptographic pools. Typically, an increase in shielded supply indicates more adoption, and vice versa. Zkp.baby data shows the total ZEC shielded supply is at a 10-month low of 3.79 million ZEC, reaffirming reduced demand for the privacy token.
On the retail side, the speculative demand for Zcash is easing. CoinGlass data show that ZEC futures Open Interest (OI) is down over 3% in the last 24 hours to $793.41 million, indicating a minor positional wipeout or a reduction in notional value as the ZEC price declines. Meanwhile, the funding rate has dropped to 0.0071% from 0.0091% the previous day, implying reduced demand for long positions.
Technical outlook: Will Zcash break below its support trendline?
Zcash maintains a near-term bearish tone, trading below the 50-day Exponential Moving Average (EMA) at around $485 and testing a rising support trendline near $458. From a technical perspective, a sustained close below this zone could target the 200-day EMA at $404, followed by the 50% retracement level of the upswing from $207 to 690, at $378.
The Moving Average Convergence Divergence (MACD) descends into negative territory after a bearish crossover with its signal line as selling pressure resurfaces. At the same time, the Relative Strength Index (RSI) is hovering near 42, both suggesting weak momentum and limited buying conviction.
On the topside, initial resistance emerges near the 50-day EMA at $485 and the descending trendline near $561.
(The technical analysis of this story was written with the help of an AI tool. Know more.)
Author

Vishal Dixit
FXStreet
Vishal Dixit holds a B.Sc. in Chemistry from Wilson College but found his true calling in the world of crypto.




