Hyperliquid Price Forecast: HYPE nears key support as bullish flows align with surging network fees
- Hyperliquid price nears key support zone on Wednesday and if it holds, it could pave the way for an upside move.
- On-chain and derivatives data support bullish sentiment, with buy-side dominance, cooling conditions and positive funding rates.
- Artemis Terminal data shows that Hyperliquid’s 24-hour chain fees exceed those of both Tron and Solana, signaling strong network activity.

Hyperliquid (HYPE) is retesting its key support, trading around $36.70 at the time of writing on Wednesday, setting the stage for a potential rebound if buyers step in. This upside thesis for HYPE token is further supported by strengthening on-chain activity and supportive derivatives metrics.
Hyperliquid’s on-chain and derivatives data show a bullish bias
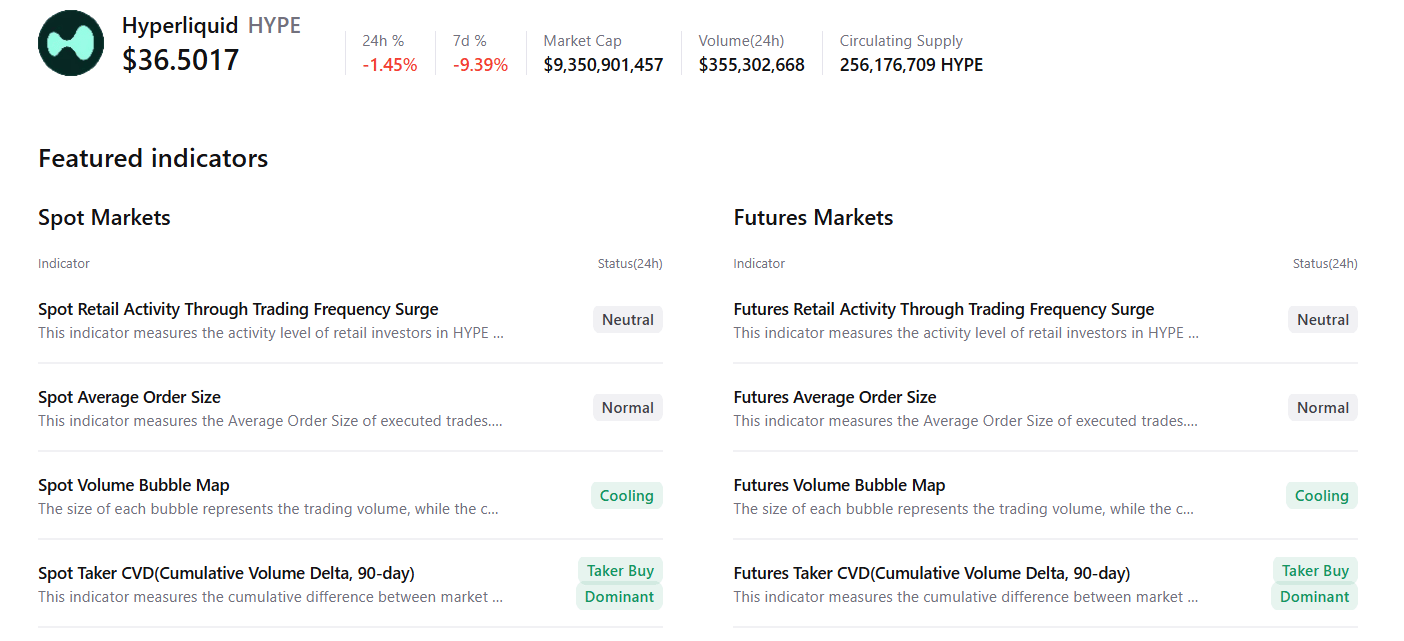
CryptoQuant summary data evidences a neutral condition with a bullish tilt. Hyperliquid’s spot and futures markets show buy-side dominance and cooling conditions, with mostly neutral conditions across other metrics, suggesting a potential upside move.
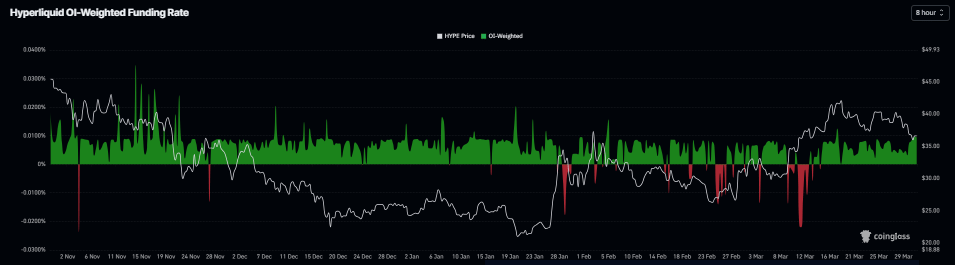
On the derivatives side, Hyperliquid’s funding rates flipped positive in mid-March and have remained positive, surging to 0.0095% on Wednesday, indicating that longs are paying shorts. Historically, as shown in the chart below, when funding rates have flipped from negative to positive and risen, the Hyperliquid price has surged.
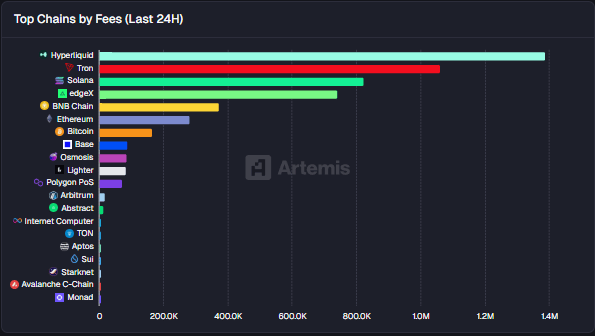
Hyperliquid’s chain fee collection surpasses Tron and Solana
According to Artemis Terminal data, Hyperliquid’s 24-hour chain fee collection is $1.4 million, topping the list of chains by fees with other networks such as Tron (TRX) and Solana (SOL), indicating growing interest among traders and liquidity on the HYPE chain.
Hyperliquid Price Forecast: HYPE nears key support zone
Hyperliquid price is trading at $36.71 on Wednesday, after correcting more than 7% since Sunday. HYPE retested the daily support level at $35.75 on Tuesday, which roughly coincides with the 50-day Exponential Moving Average (EMA) at $35.01 and the 38.20% Fibonaci retracement level at $34.87 (drawn from the January low of $20.51 to the March high of $43.75), making this a key support zone.
If HYPE finds support around these levels, it could extend the rally toward the March high of $43.75.
The Relative Strength Index (RSI) on the daily chart is 49, flat around the neutral 50 level, indicating indecision among traders following the recent sell-off. However, traders should remain cautious, as the Moving Average Convergence Divergence (MACD) indicator on the same chart showed a bearish crossover on March 23, which remains intact, supporting a negative outlook.
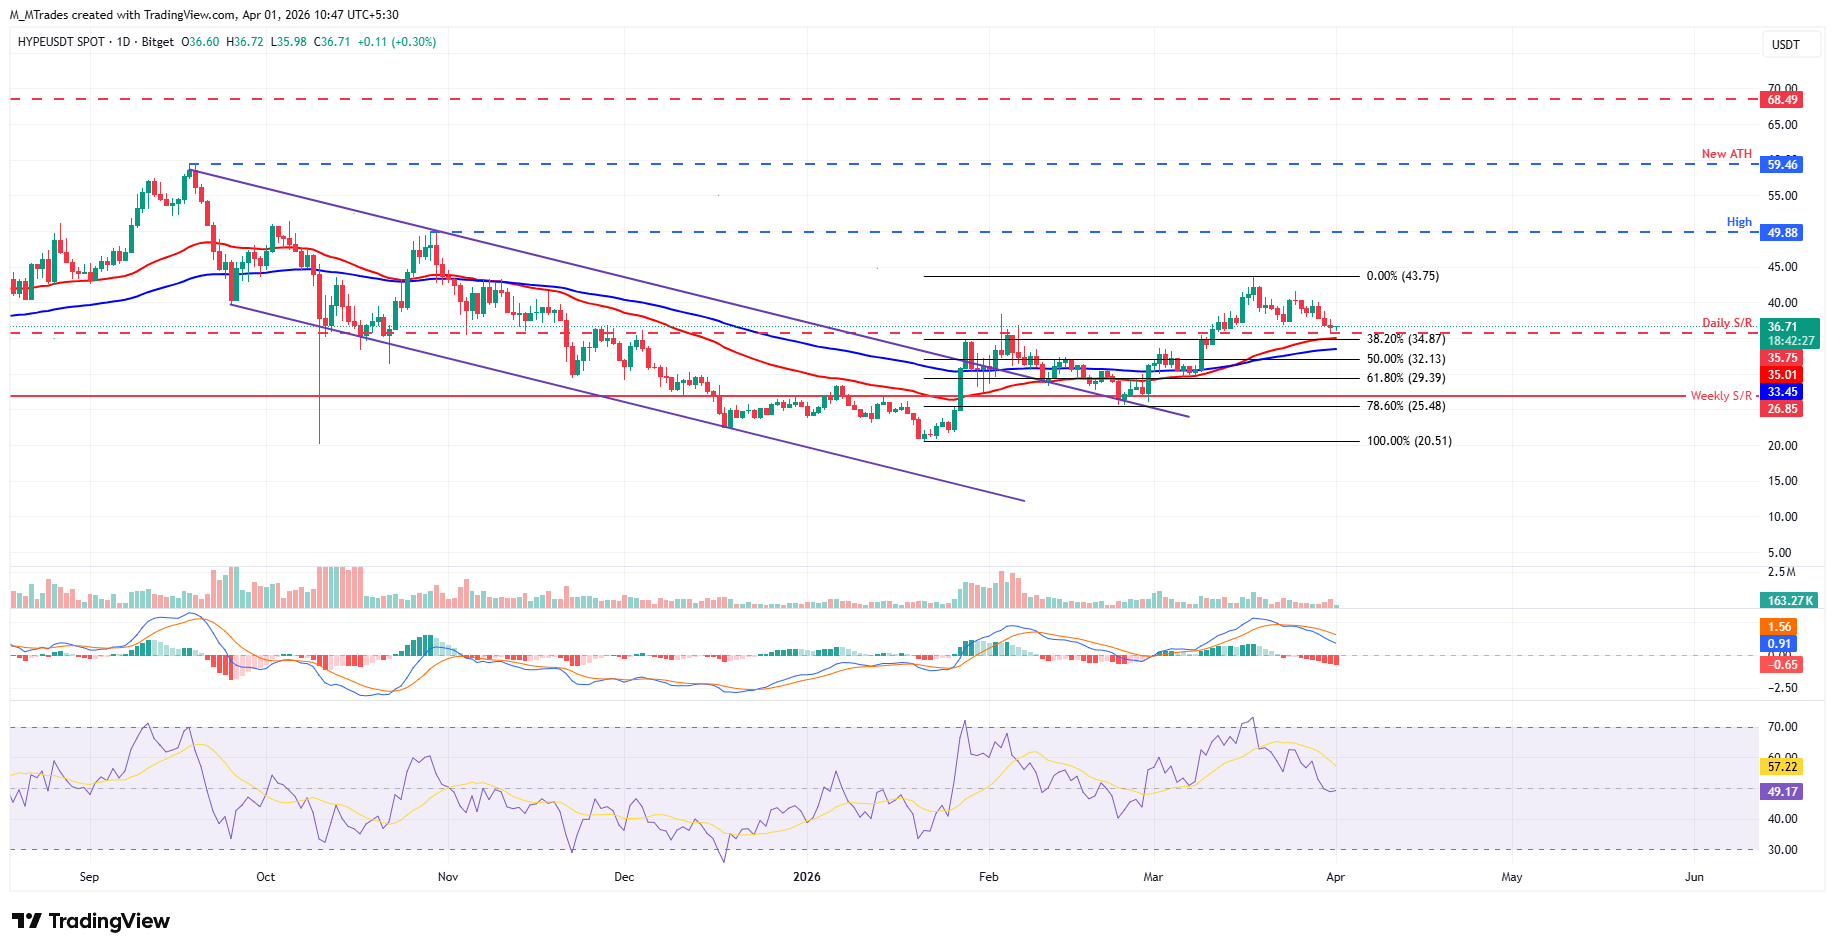
If HYPE fails to find support around the 50-day EMA at $35.01 and closes below it on a daily basis, it could extend the decline toward the 100-day EMA at $33.45.
Author

Manish Chhetri
FXStreet
Manish Chhetri is a crypto specialist with over four years of experience in the cryptocurrency industry.




