Hyperliquid Price Forecast: HYPE bulls target $50 as on-chain, derivatives data supports rally
- Hyperliquid price steadies at $40 on Tuesday after surging nearly 10% the previous day.
- On-chain and derivatives data back bullish sentiment with large whale orders alongside rising open interest.
- The technical outlook suggests a further rally with bulls aiming for $50 HYPE.

Hyperliquid (HYPE) price holds above $40 as of writing on Tuesday after rallying nearly 10% the previous day. Strengthening on-chain and derivatives data support a bullish sentiment, while the technical outlook suggests further gains toward the key level at $50.
On-chain and derivatives data back bullish sentiment
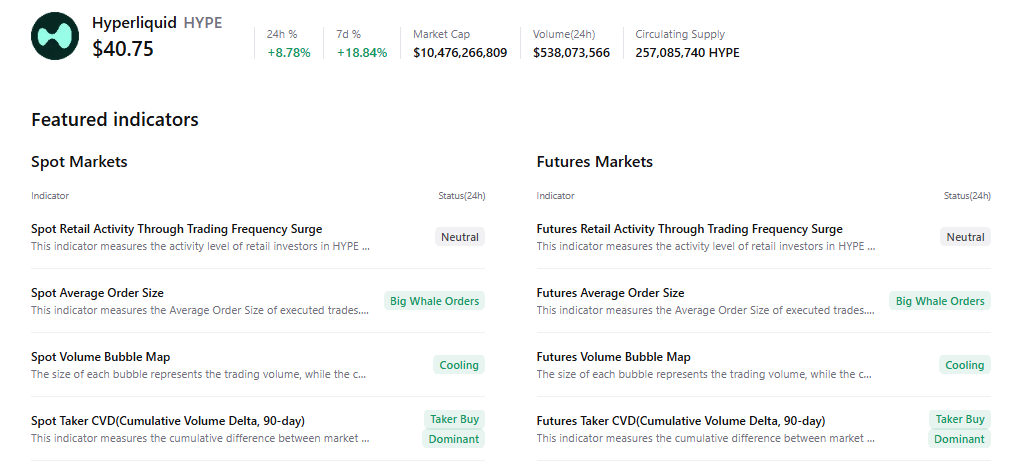
CryptoQuant’s summary data supports the positive outlook, as HYPE’s spot and futures markets show large whale orders, cooling conditions, and buy dominance, all of which signal a potential upside move.
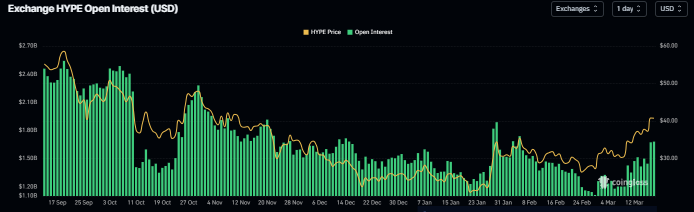
On the derivatives front, Coinglass Open Interest (OI) for Hyperliquid surged to $1.68 billion on Tuesday, the highest level since early February, and has been steadily rising since early March. An increasing OI represents new or additional money entering the market and new buying, which could fuel the current HYPE price rally.
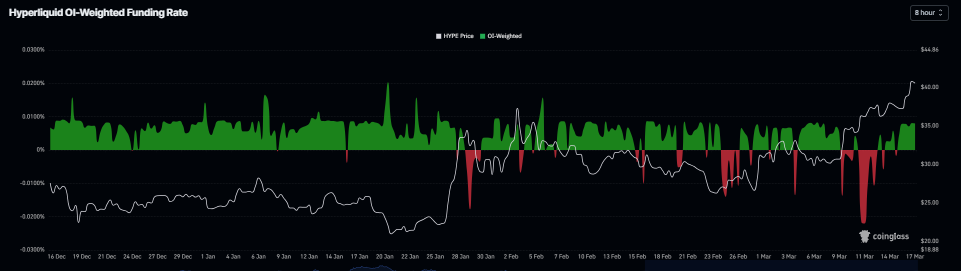
In addition, Hyperliquid’s funding rates flipped positive on Sunday and surged to 0.008% on Tuesday, indicating that longs are paying shorts. Historically, as shown in the chart below, when funding rates have flipped from negative to positive and risen, the Hyperliquid price has surged.
Hyperliquid Price Forecast: HYPE bulls aiming for the $50 mark
Hyperliquid price broke above the daily resistance level at $36.51 on Thursday and found support around this level the next day, surging over 12% through Monday. As of Tuesday, HYPE is steady at $40.
If HYPE continues its upward trend, it could extend the rally toward the key psychological level at $50. However, traders should be cautious around the October 29 high of $49.88, where investors previously sold HYPE, making it a key level to watch.
The Relative Strength Index (RSI) on the daily chart is 70, near overbought territory, indicating strong bullish momentum, but a slight pullback within the upward trend is possible. The Moving Average Convergence Divergence (MACD) showed a bullish crossover, with rising green histogram bars further supporting the bullish thesis.
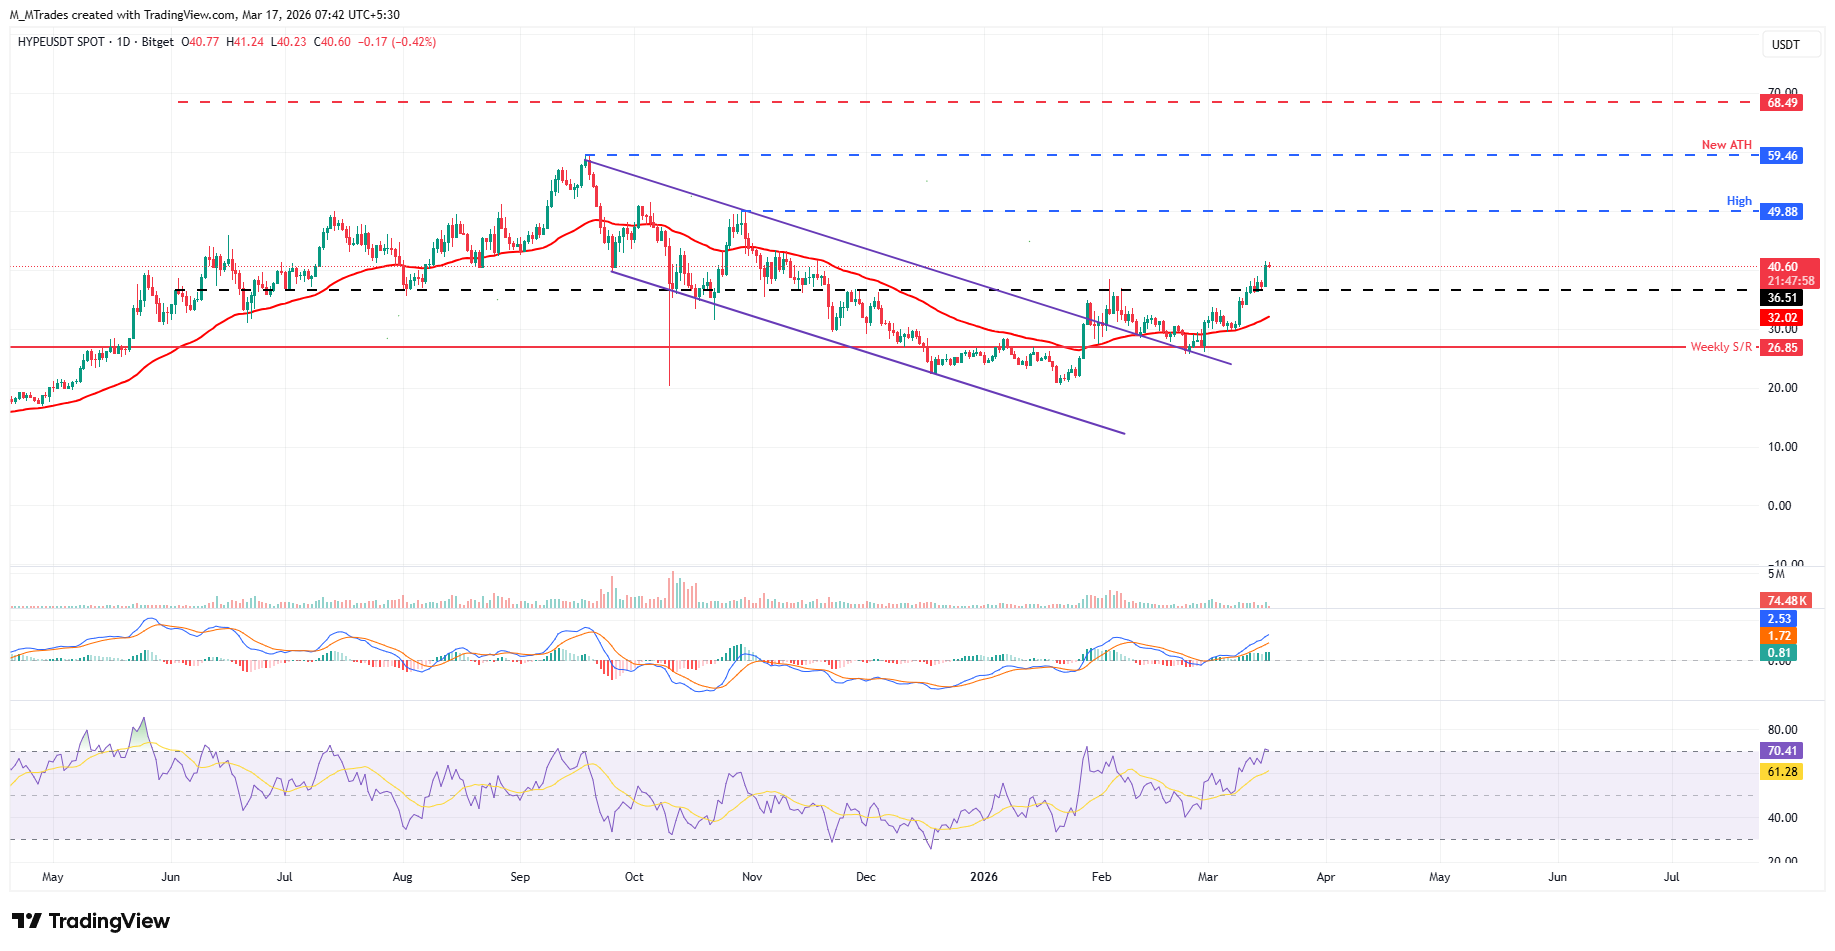
However, if HYPE corrects, it could extend the decline toward the daily support level at $36.51.
Author

Manish Chhetri
FXStreet
Manish Chhetri is a crypto specialist with over four years of experience in the cryptocurrency industry.



