Dogecoin Price Forecast: DOGE eyes breakout as trendline test coincides with Qubic mainnet launch
- Dogecoin price is nearing the descending trendline on Tuesday, a breakout suggests a bullish move ahead.
- Qubic’s DOGE mining mainnet is set to launch on Wednesday, fueling a bullish narrative.
- The technical outlook suggests a possible recovery as bearish momentum fades.

Dogecoin (DOGE) is approaching the descending trendline, trading at $0.092 on Tuesday, which could determine DOGE’s next directional move. A confirmed breakout could suggest an upside move, as optimism builds around Qubic’s DOGE mining mainnet launch scheduled for Wednesday. On the technical side, fading bearish momentum also supports a potential recovery.
Qubic meets DOGE
Qubic, a layer-1 (L1) blockchain protocol, has scheduled the launch of its Dogecoin mining mainnet for this Wednesday. The design phase and the project plan have been finalized and completed so far. Moreover, Qubic has already demonstrated that its compute layer can mine external assets using Monero (XMR); it is now focusing on Dogecoin.
“The miners securing this network and training AI will also be able to mine one of the most widely recognized cryptocurrencies in existence,” said Qubic on its X post.
Qubic further explained, “That means more utility from the same energy. More value flowing through the same infrastructure.”
This development is potentially bullish for Dogecoin as it increases mining demand, boosting network security and hashrate without the usual energy waste. In the short term, this development could act as a bullish narrative for the meme coin.
Dogecoin Price Forecast: DOGE nears descending trendline
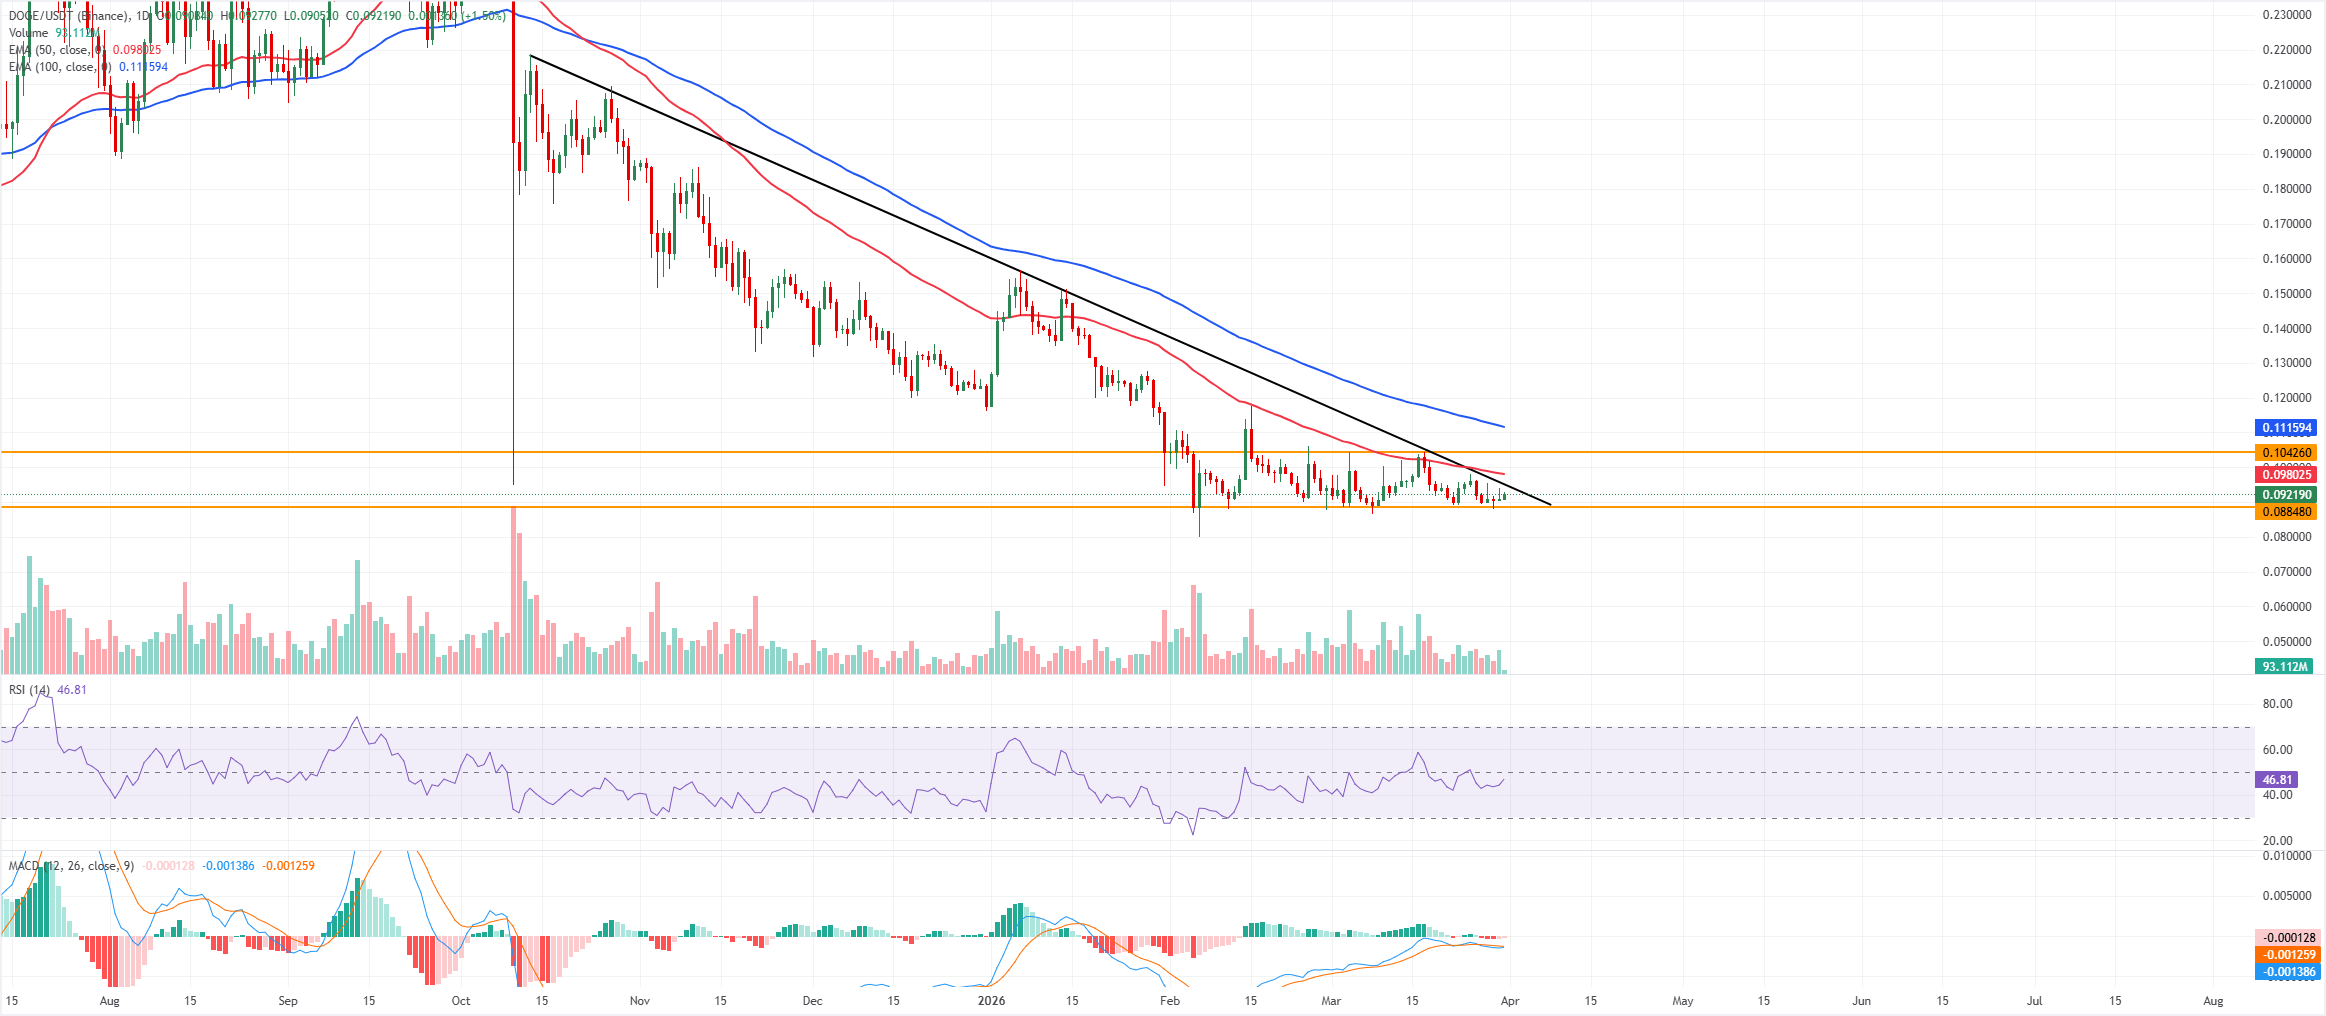
Dogecoin price is trading at $0.092 on Tuesday, following a slight recovery the previous day. The near-term tone stays neutral with a slight bullish tilt as price holds above the $0.088 horizontal support while grinding just under the descending trendline stemming from $0.218, whose break zone sits near $0.095.
Daily closes remain capped below the falling 50-day and 100-day Exponential Moving Averages (EMAs) clustered around the upper-$0.09 to low-$0.11 area, keeping the broader trend under pressure even as downside momentum fades.
The Relative Strength Index (RSI) on the daily chart at 46 drifts just below the midline, and the Moving Average Convergence Divergence (MACD) indicator hovers marginally below its signal line around the zero line, both reinforcing a consolidative backdrop rather than a directional breakout.
Immediate support is located at $0.088, where the horizontal line aligns with the recent reaction low, and a daily close below this floor would expose the upper-$0.080 area as the next bearish objective.
On the topside, initial resistance is seen near the trendline near $0.095, followed by the $0.098–$0.100 region where the 50-day EMA resides. A sustained push above $0.095 would open the way toward the $0.104 horizontal resistance, with a clear break there being needed to negate the broader downside bias implied by the higher-timeframe averages and signal a more durable recovery phase.
(The technical analysis of this story was written with the help of an AI tool.)
Author

Manish Chhetri
FXStreet
Manish Chhetri is a crypto specialist with over four years of experience in the cryptocurrency industry.