Has Bitcoin price bottomed? Technical indicator shows buy signal
- Bitcoin price prints first green candle after nine consecutive bearish weeks.
- Bitcoin price shows significant accumulation on the Volume Profile Indicator.
- Invalidation of the bullish uptrend lies at $22,000.

Bitcoin price shows bullish signals worthy of reinvesting capital into the peer-to-peer digital currency. The invalidation point is vital for investors entering the market.
Bitcoin price rises from the ashes
Bitcoin price shows newfound bullish optimism as the bulls have hurdled past the previous resistance zone at $30,000. This weekend, BTC price saw a significant change in the market, the bulls were able to print a green inverted hammer on the weekly chart. The candle is being revered amongst the crypto community as it is the first bullish candle to successfully print in the last nine weeks.
Bitcoin price trades at $31,510 on Monday as sidelined investors are coming out to contribute their offerings to the original crypto currency’s promising forecast. The volume indicator shows a considerable amount of trading interest within the current zone. History has shown that BTC tends to spend significant time within sideways zones before chaotic news correlated events accompanied with highly favored volatility arise. If market conditions persist, Bitcoin price could be on pace to rally back towards $39,000 but a breach above $33,660 will be needed first to confound this idea.
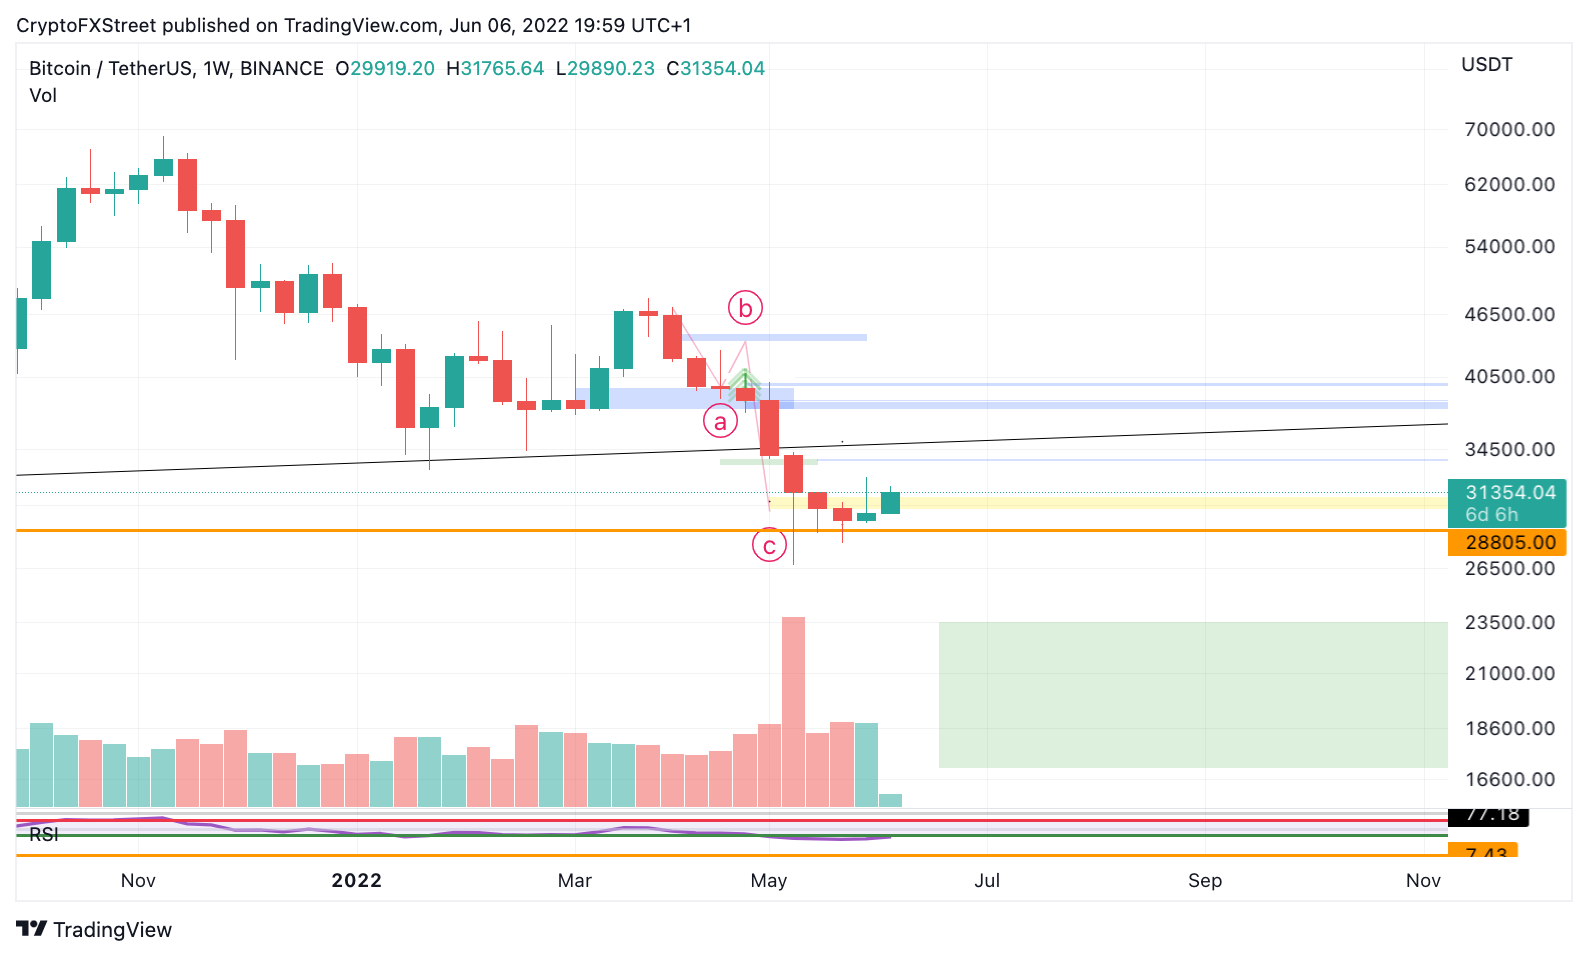
BTC/USDT 1-Week Chart
Placing a safety stop below the current price action lows is still too high-risk. A better invalidation point will be at levels untouched this year. For that reason $22,000 is the new invalidation level for investors looking to participate in the market with both a trading plan and/or dollar cost average approach. If $22,000 were to get breached, the next target would be $17,000 resulting in a 44% decrease from the current BTC price.
Author

Tony M.
FXStreet Contributor
Tony Montpeirous began investing in cryptocurrencies in 2017. His trading style incorporates Elliot Wave, Auction Market Theory, Fibonacci and price action as the cornerstone of his technical analysis.



