Ethereum Technical Analysis: ETH/USD it is vital that the bulls break back above $160-170 or be punished
- Ethereum price on Thursday is underperforming, trading down some 0.25%.
- ETH/USD bulls are struggling to breakdown again big supply running from $160-170 range.

ETH/USD 15-minute chart
- Price action moving within a bearish flag pattern formation via the 15-minute view.
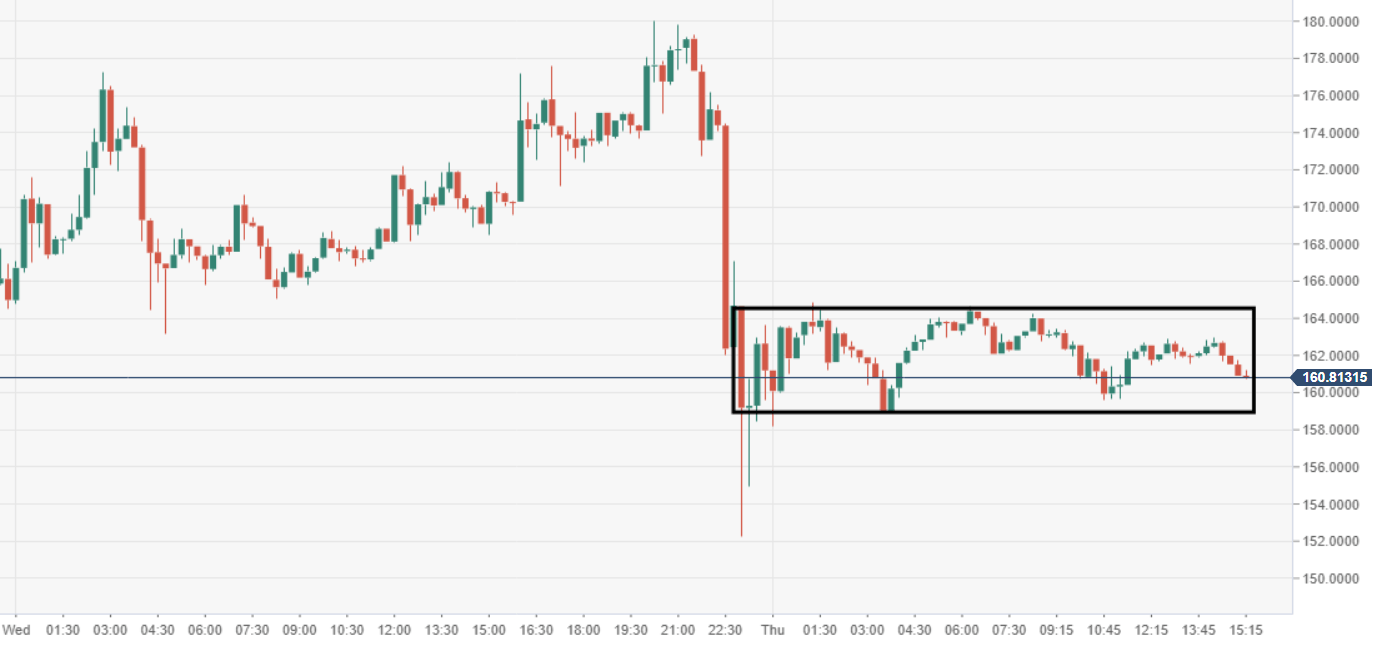
Spot rate: 160.22
Relative change: -0.25%
High: 164.83
Low: 158.14
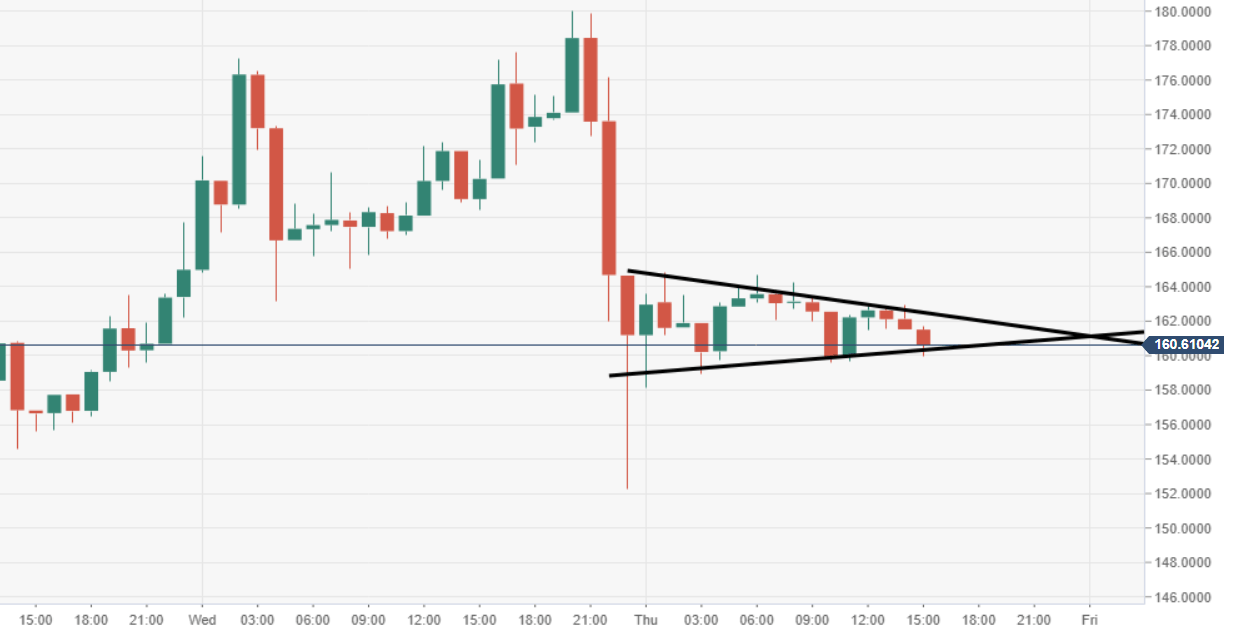
ETH/USD 60-minute chart
- Looking via the 60-minute the pattern structure appears to be bearish, a potential bearish pennant.
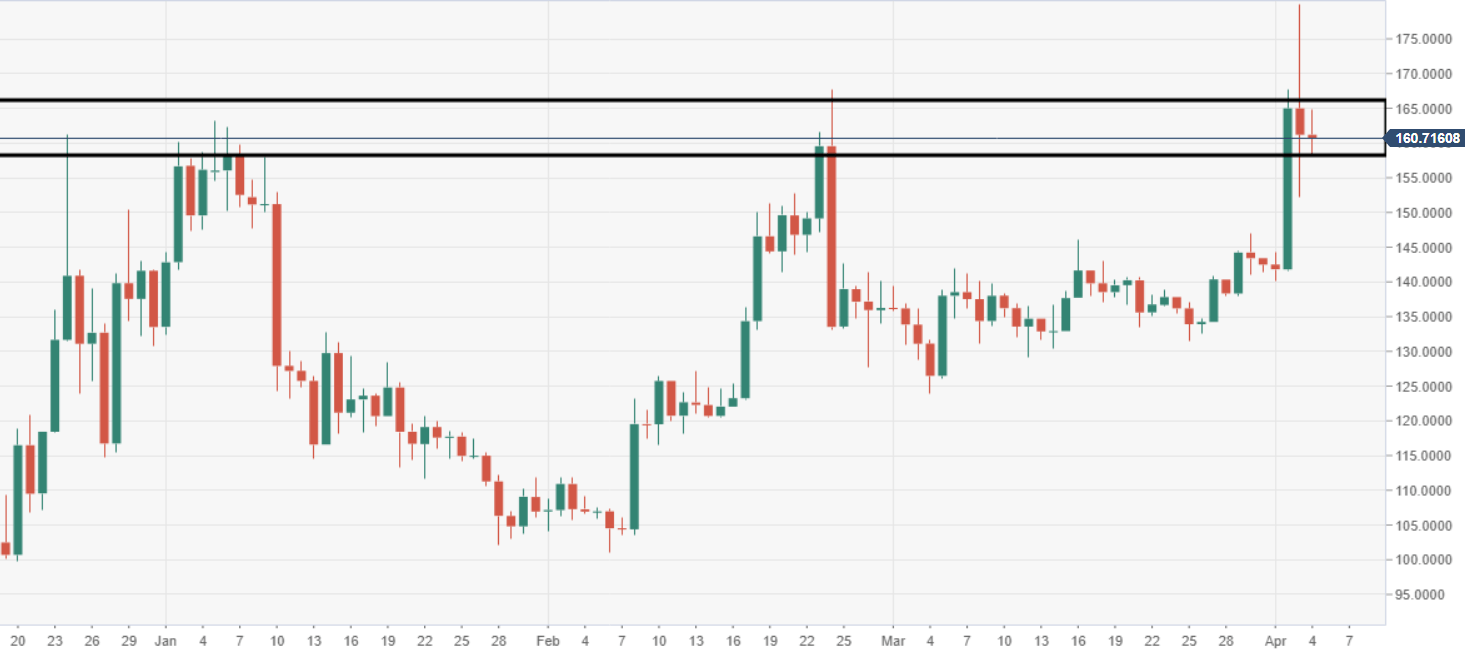
ETH/USD daily chart
- Bulls are struggling to break down the $160-170 area convincingly, which is the key for $200 return.
Author

Ken Chigbo
Independent Analyst
Ken has over 8 years exposure to the financial markets. He started his career as an analyst, covering a variety of asset classes; forex, fixed income, commodities and equities.
More from Ken Chigbo


