Ethereum Technical Analysis: ETH/USD can not withstand a bull rally and it is sold off
- Ethereum price is trading with minor gains on Friday of 0.7%, being kept propped up for now by near-term ascending trend lines.
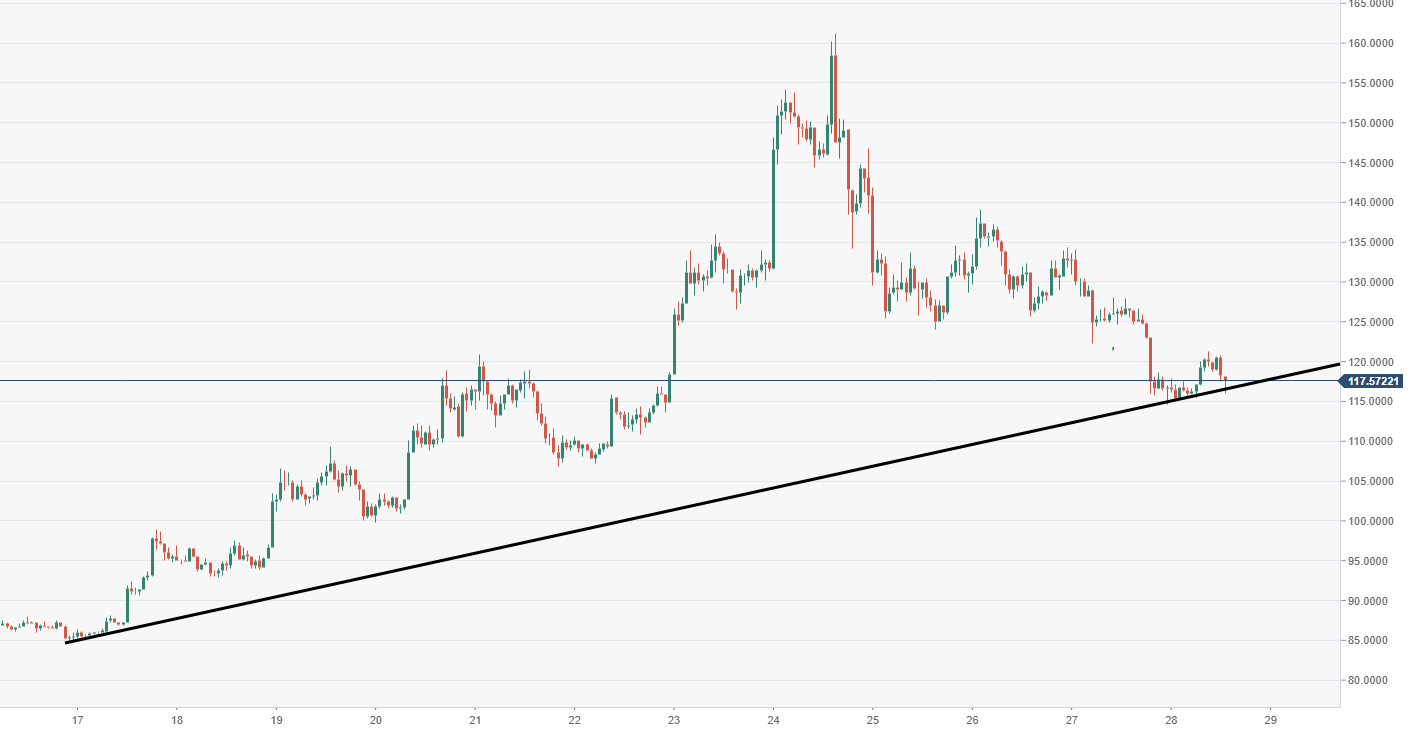
- ETH/USD remains vulnerable to giving back the bull run gains seen between 16-24 Dec.

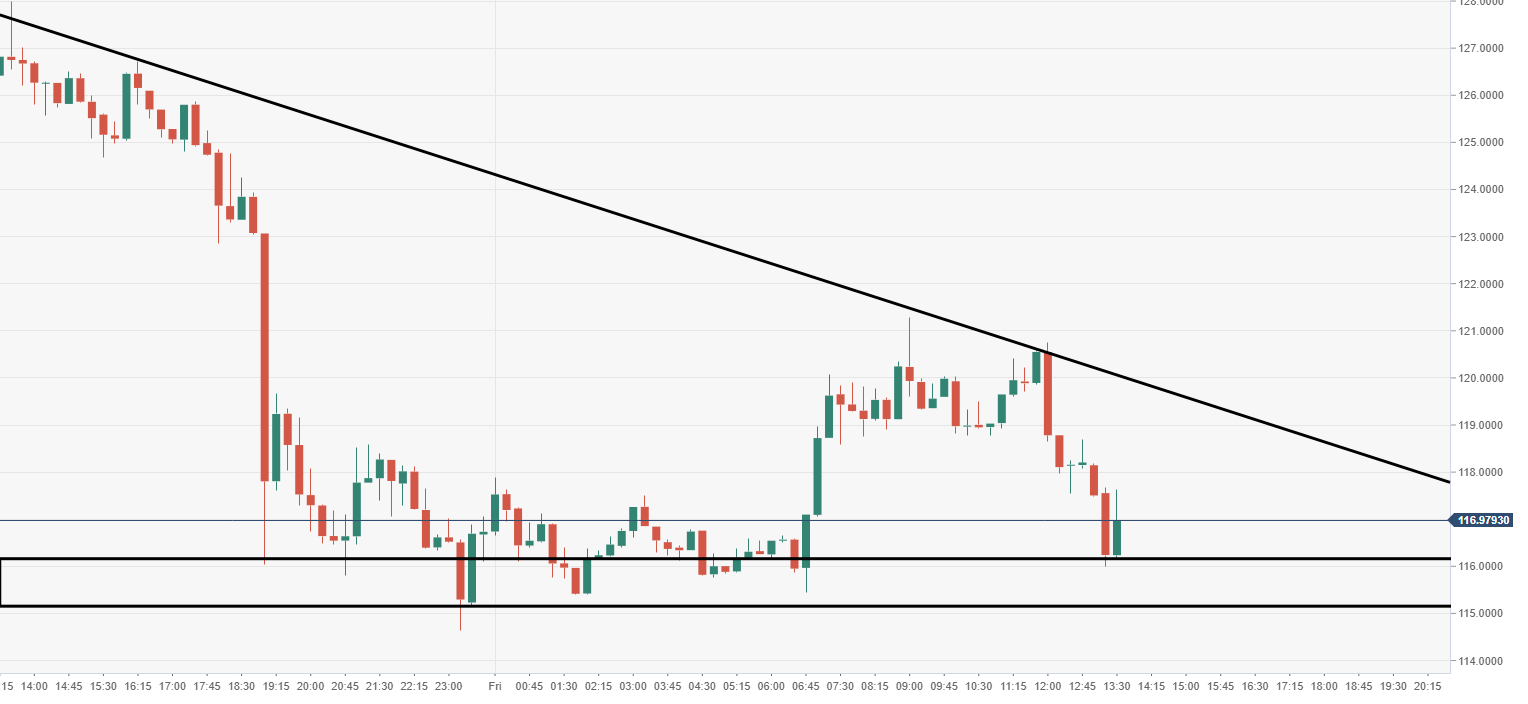
ETH/USD 15-minute chart
- ETH/USD is being saved for now by a near-term demand area, $115-116.
Spot rate: 117.05
Relative change: +0.45%
High: 120.74
Low: 115.99
Trend: Neutral
Support 1: 116-115.00, near-term demand zone (15-minute).
Support 2: 109.58, daily pivot point support.
Support 3: 102.42, daily pivot point support.
Resistance 1: 128.97, daily pivot point resistance.
Resistance 2: 141.20, daily pivot point resistance.
Resistance 3: 148.35, daily pivot point resistance.
ETH/USD 60-minute chart
- Price action has cooled back south to an ascending trend line, which formed at the start of the 16th December uptrend.
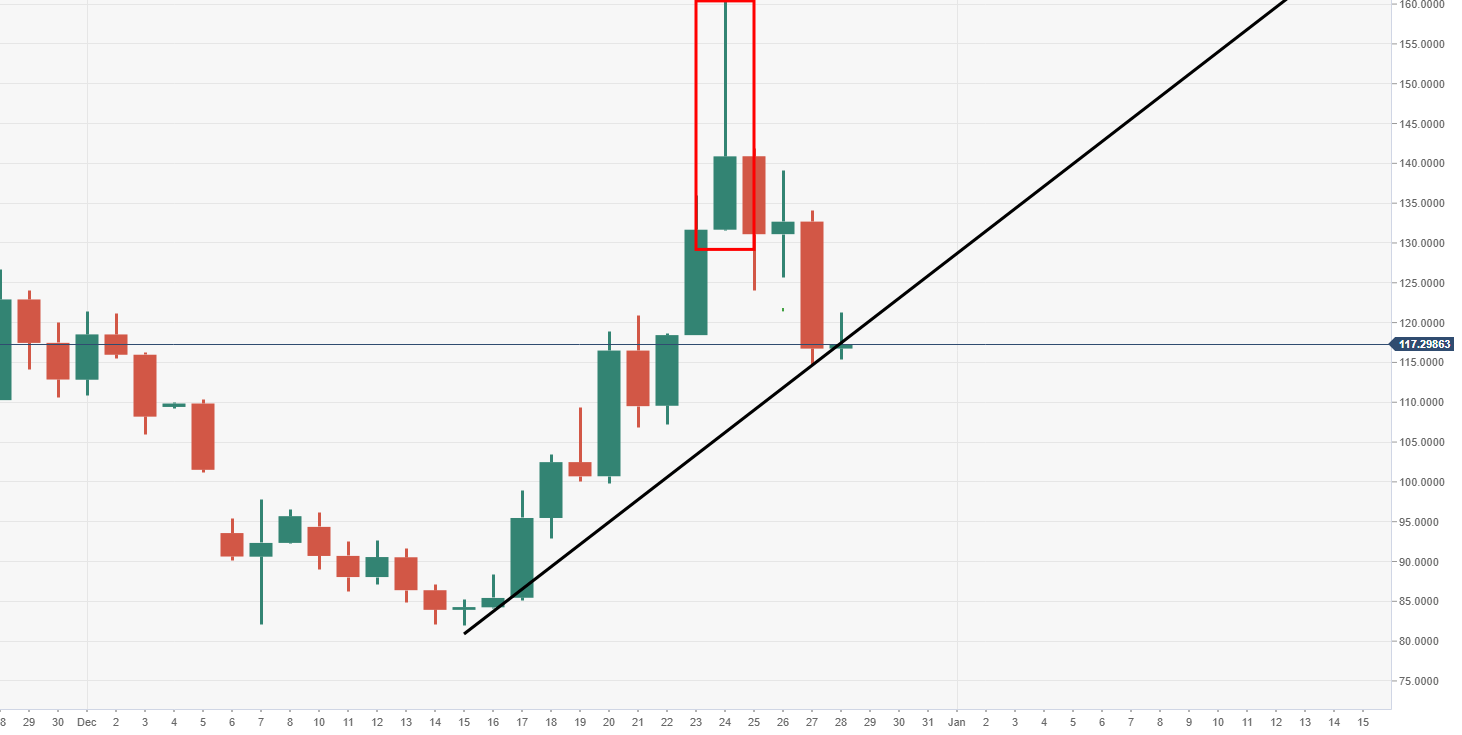
ETH/USD daily chart
A key near-term ascending trend line is preventing a total reversal of the 15-24 Dec bull run, for now.
Author

Ken Chigbo
Independent Analyst
Ken has over 8 years exposure to the financial markets. He started his career as an analyst, covering a variety of asset classes; forex, fixed income, commodities and equities.


