Ethereum Technical Analysis: Bulls eyeing greater gains, with new 2019 highs in sight
- Ethereum price on Tuesday was trading comfortably in the green up some 1.7%.
- A breakout appears to be imminent as price action narrows within a pennant pattern.

ETH/USD 15-minute chart
- Price action is narrowing greatly within the triangular/pennant pattern, the breakout is nearing.
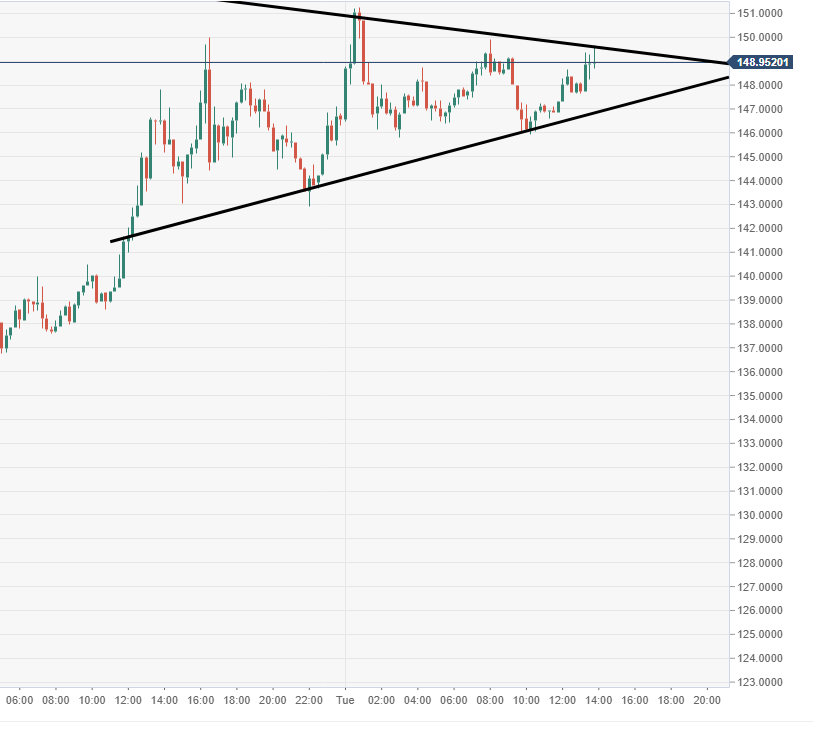
Spot rate: 149.22
Relative change: +1.71%
High: 151.26
Low: 145.80
Trend: Bullish
Trends:
Daily SMA20: 117.08
Daily SMA50: 124.43
Daily SMA100: 126.45
Daily SMA200: 187.78
Levels:
Previous Daily High: 149.99
Previous Daily Low: 133.09
Previous Weekly High: 127.09
Previous Weekly Low: 116.48
Previous Monthly High: 163.23
Previous Monthly Low: 102.17
Daily Fibonacci 38.2%: 143.53
Daily Fibonacci 61.8%: 139.54
Daily Pivot Point S1: 136.44
Daily Pivot Point S2: 126.31
Daily Pivot Point S3: 119.54
Daily Pivot Point R1: 153.34
Daily Pivot Point R2: 160.11
Daily Pivot Point R3: 170.24
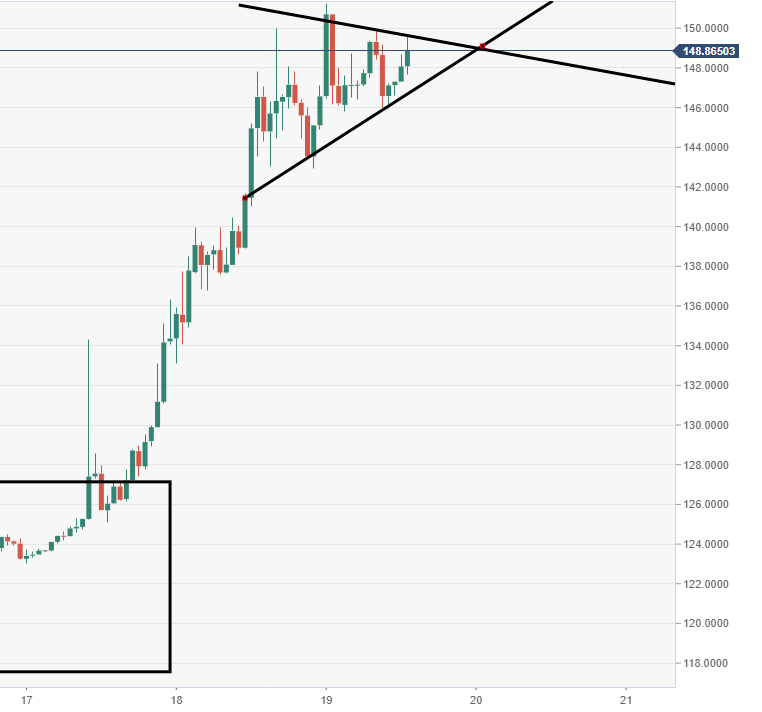
ETH/USD 60-minute chart
- Price action has formed a bullish pennant pattern which is subject to a possible breakout north.
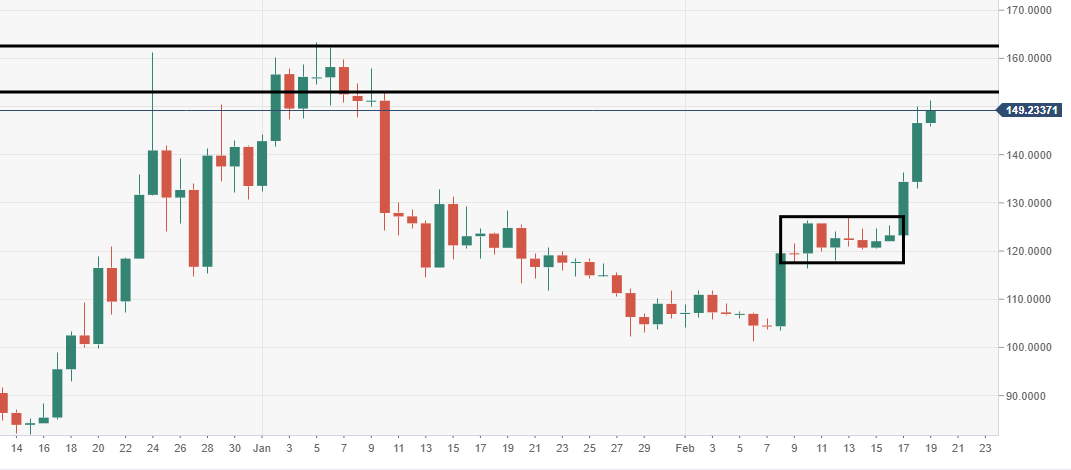
ETH/USD daily chart
- Bulls set to retest the big high area of 2019, supply observed from $150-160 range.
Author

Ken Chigbo
Independent Analyst
Ken has over 8 years exposure to the financial markets. He started his career as an analyst, covering a variety of asset classes; forex, fixed income, commodities and equities.


