|

Ethereum Price Analysis: Looking into the ETH/USD and ETH/BTC daily charts as bearish correction begins

  • ETH/USD had flown up from $152.85 to $172.58 this Thursday.
  • ETH/BTC lost momentum at the 0.0243 resistance level.

ETH/USD daily chart

ETH/USD daily chart

ETH/USD faced a bearish start to the day following an overtly bullish Thursday. The price has gone down slightly from $172.58 to $171.69 and is currently facing resistance at the downward trending line and the SMA 200 curve. This Thursday, ETH/USD broke past the SMA 50 during its ascent from $152.85 to $172.58. The Elliott Oscillator has had two green sessions following two straight red sessions.

ETH/BTC daily chart

ETH/BTC daily chart

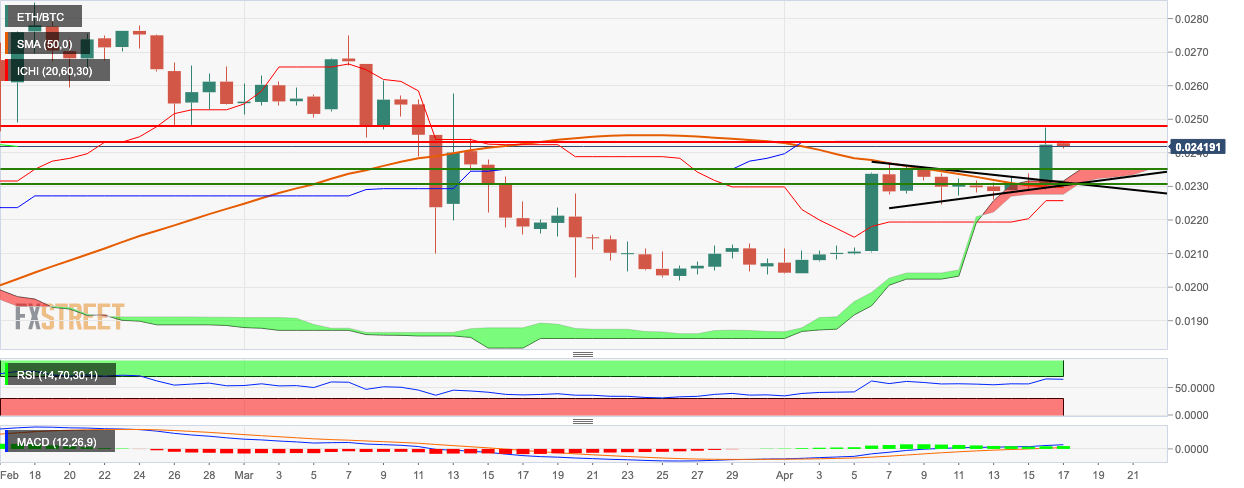
ETH/BTC bounced off the red Ichimoku cloud and went up from 0.023 to 0.0243 this Thursday, breaking above the pennant structure, in the process. This breakout was an early indicator of the crypto market’s overall bullish movement this Thursday. Currently, tt looks like the bulls have run out of steam near the 0.0243 level as ETH/BTC has dropped a bit to 0.0242. The RSI indicator is trending horizontally around 67.27, next to the overbought zone.

Key levels

ETH/USD

Overview
Today last price170.69
Today Daily Change-1.88
Today Daily Change %-1.09
Today daily open172.57
 
Trends
Daily SMA20151.18
Daily SMA50162.99
Daily SMA100183.06
Daily SMA200172.2
 
Levels
Previous Daily High174.94
Previous Daily Low148.3
Previous Weekly High176.48
Previous Weekly Low140.8
Previous Monthly High252.76
Previous Monthly Low89.65
Daily Fibonacci 38.2%164.76
Daily Fibonacci 61.8%158.48
Daily Pivot Point S1155.6
Daily Pivot Point S2138.64
Daily Pivot Point S3128.97
Daily Pivot Point R1182.23
Daily Pivot Point R2191.9
Daily Pivot Point R3208.86

Author

Rajarshi Mitra

Rajarshi Mitra

Independent Analyst

Rajarshi entered the blockchain space in 2016. He is a blockchain researcher who has worked for Blockgeeks and has done research work for several ICOs. He gets regularly invited to give talks on the blockchain technology and cryptocurrencies.

More from Rajarshi Mitra
Share:

Editor's Picks

Ethereum Price Forecast: Long-term holders' capitulation drives ETH below $1,800

Ethereum has fallen below $1,800 on Wednesday, the first time since May 2025 following accelerated spot selling pressure and distributions from long-term holders.

XRP and XLM outlook: Bearish streak extends as risk-off mood erodes retail demand, ETF flows

Ripple and Stellar prices face intense selling pressure, extending losses on Thursday for the fourth consecutive day this week. Cross-border remittance tokens are losing retail sentiment, while XRP faces additional pressure from Exchange-Traded Fund outflows. 

Bitcoin drops below $65K amid reinforced bear market signals

Bitcoin dipped further below $65,000 with onchain data from Glassnode signaling a market firmly in a bear phase. The decline has pushed prices back into a key valuation range between the Realized Price and the True Market Mean.

Grayscale launches Hyperliquid staking ETF, undercutting rival fees

Grayscale announced the launch of its Hyperliquid Staking ETF (HYPG) on Wednesday, now trading on Nasdaq. The fund offers investors direct exposure to HYPE and incorporates staking rewards, which the company claims have historically ranged from 2.2% to 2.3% annually.

Billions in ETF outflows don’t bode well
Bitcoin (BTC) remains under pressure, trading below $74,000 on Friday, and is set to post its third consecutive week of losses. The institutional sell-off continues, with spot BTC Exchange-Traded funds (ETFs) recording billions in outflows. In addition, sticky inflation and macroeconomic headwinds suppress the Crypto King’s upside potential. Institutional demand continues to weaken so far this week.