Ethereum Price Analysis: ETH/USD stares in the abyss with the bottom at $80.00
- ETH/USD has broken below several support levels.
- Crypto analyst noted strange transactions on the Ethereum network.

ETH/USD lost nearly 15% of its value in just two days. At the time of writing, the second-largest digital asset is changing hands at $121.50. During early Asian hours, ETH/USD tested $120.80, which is the lowest level since December 2018. Ethereum is one of the worst-performing altcoins out of top-10 as the breakthrough in the vital support area increased the bearish pressure. On a day-to-day basis, ETH/USD is down nearly 7%.
While the current sell-off has been driven mostly by technical factors and overall bearish sentiments on the cryptocurrency markets, the cryptocurrency expert and crypto data scientist Alex Svanevik noted some strange activity in the Ethereum network. As it turns out, an investor that participated in ETH ICO has been selling significant amounts of ETH recently.
Curious who this ETH ICO participant is: https://etherscan.io/address/0x51f9c432a4e59ac86282d6adab4c2eb8919160eb/ They've dumped (?) almost 300k ETH in the last few months - after hodling 530k ETH since the ICO in 2015. 3 days ago they transferred 60k ETH out of their wallet.
The first large-scale transaction was processed in September and the last one happened on December 12. In the previous three months, ETH/USD l=has lost over 42% of its value, with the most violent sell-offs taking place in November and December.
Ethereum's technical picture
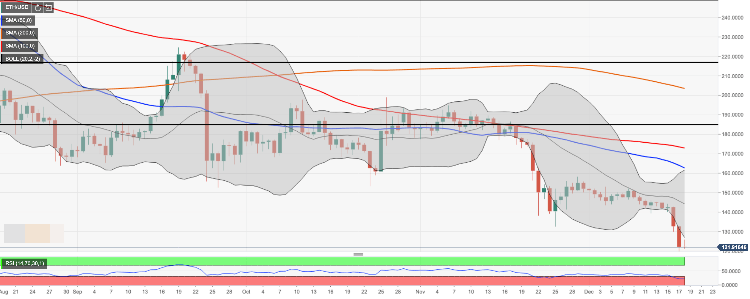
From the long-term perspective, a sustainable move below $132.00-$130.00 area may result in a deep decline towards December 2018 low reached at $80.00. The downward-looking RSI (Relative Strength Index) confirms this bearish view. The weekly chart is no less pessimistic at this stage as the RSI also points downwards with no signs of an upcoming reversal.
Meanwhile, it should be noted that ETH/USD broke below the lower line of the weekly Bollinger Band (currently at $131.50). It may signal that the market is ready to ender a consolidation phase or rebound as the price tends to return inside the Bollinger Band.
Now the critical support waits for us on approach to $120.00. Once it is out of the way, the sell-off may continue towards $100.00 and $80.00 (2018 low).
On the upside, a sustainable move above $131.50 ( the lower line of the weekly Bollinger Band) will allow for an extended recovery towards $140.00 and $144.00 ( the middle line of the daily Bollinger Band and the previous support).
ETH/USD, the daily chart
Author

Tanya Abrosimova
Independent Analyst


