Ethereum Elliott Wave technical analysis [Video]
![Ethereum Elliott Wave technical analysis [Video]](https://editorial.fxsstatic.com/images/i/ETH-bearish-object.png)
Elliott Wave Analysis TradingLounge.
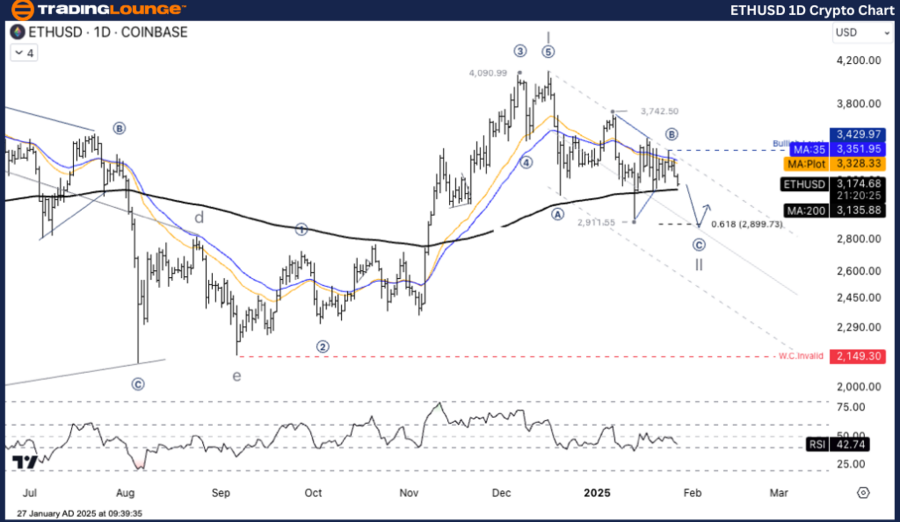
ETH/USD Elliott Wave Technical Analysis
Function: Counter Trend.
Mode: Corrective.
Structure: Zigzag.
Position: Wave C.
Direction next higher degrees: wave II.
ETH/ US Dollar (ETHUSD) Trading Strategy: Ethereum (ETH/USD) is in the middle of a Wave II correction, with Wave C projected to target the 2,899.73 USD level. A breakdown above 3,429.97 USD would invalidate this bearish corrective scenario and signal the resumption of the uptrend.
Trading strategies
- If ETH holds the support at $2,899.73 and forms a reversal, it would confirm the completion of Wave II.
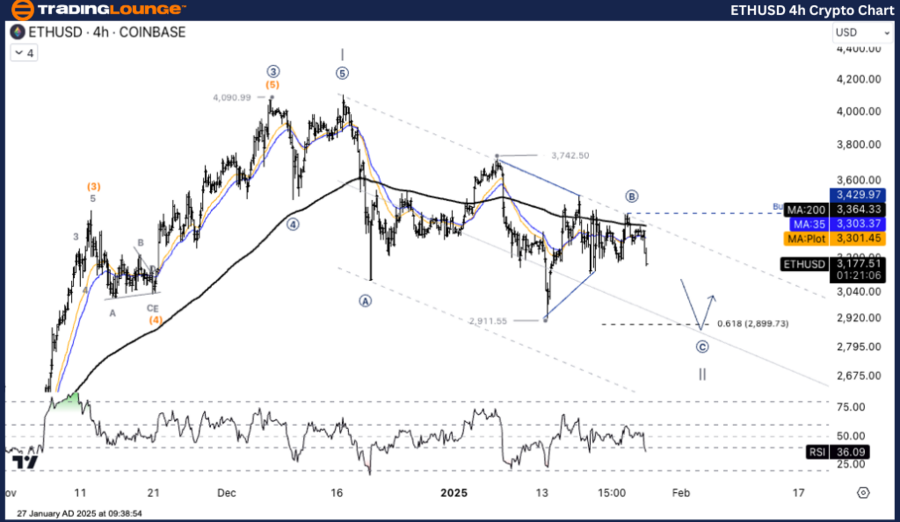
ETH/USD Elliott Wave technical analysis
Function: Counter Trend
Mode: Corrective
Structure: Zigzag
Position: Wave C
Direction next higher degrees: Wave II
ETH/ US Dollar (ETHUSD) Trading Strategy: The chart shows a complete Wave 1 structure, followed by a corrective Wave 2 in progress.The correction appears to follow a zigzag pattern (A-B-C), with Wave A completed and Wave B currently forming.The projection for Wave C indicates a potential drop to the 0.786 Fibonacci retracement level, around 0.03217 USDT.
Trading strategies
- If ETH holds the support at $2,899.73 and forms a reversal, it would confirm the completion of Wave II.
Ethereum Elliott Wave technical analysis [Video]
Author

Peter Mathers
TradingLounge
Peter Mathers started actively trading in 1982. He began his career at Hoei and Shoin, a Japanese futures trading company.


