Ethereum dominance came into strong support

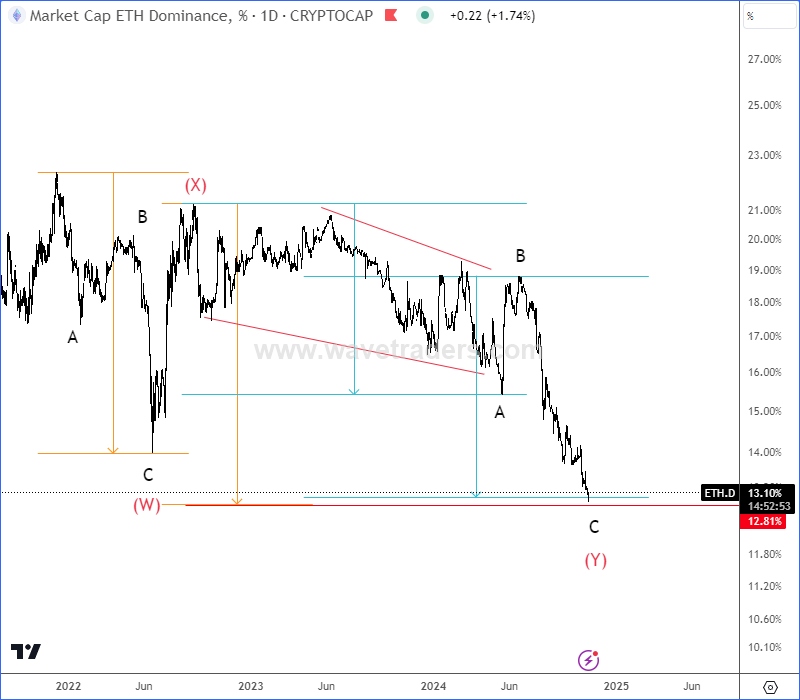
If we take a look at Ethereum.dominance chart with ticker ETH.D, we can see it approaching interesting and strong support area for wave C of (Y) with equal wave length of waves A=C and (W)=(Y) that can belong to a complex (W)-(X)-(Y) corrective setback, so be aware of bounce and recovery, which can recover the Ethereum price.
ETH.D daily chart
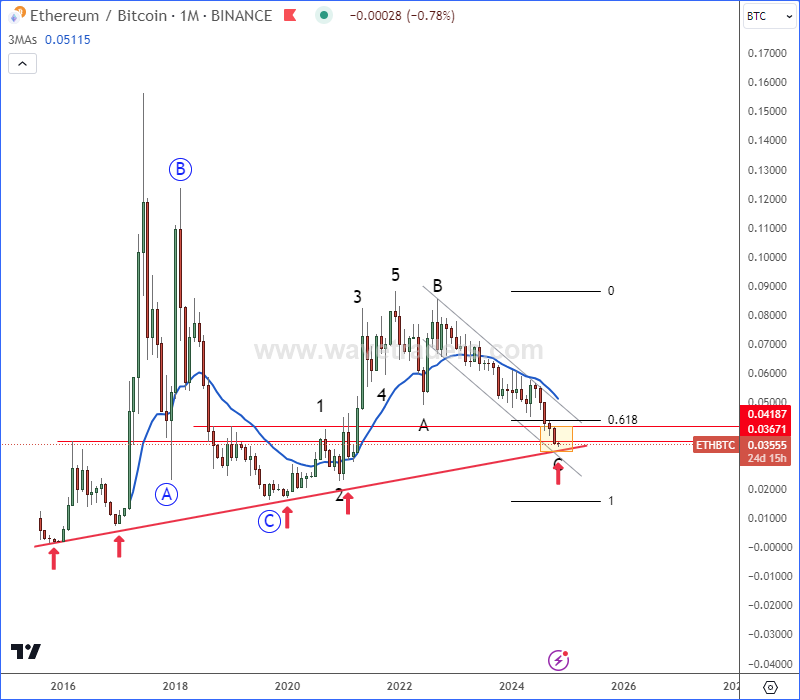
Considering that Ethereum dominance is nearing strong support while it's finishing a complex W-X-Y correction, we should also keep an eye on the weekly ETHBTC chart, which is also trading at strong weekly trendline within a three-wave A-B-C correction that can rebound the price, where Ethereum may start outperforming Bitcoin.
ETHBTC weekly chart
Is Ethereum about to rally and to follow Bitcoin in the current bullish Crypto market?
Get Full Access To Our Premium Elliott Wave Analysis For 14 Days. Click here.
Get Full Access To Our Premium Elliott Wave Analysis For 14 Days. Click here.
Author

Gregor Horvat
Wavetraders
Experience Grega is based in Slovenia and has been in the Forex market since 2003.


