DASH Price Analysis: DASH aims for a 75% breakout to $250
- Dash price is currently bounded inside a long-term symmetrical triangle on the weekly chart.
- The recent bullish momentum could be enough to push DASH into a massive breakout.

Dash is up by 100% since November 2020 and bulls aim to continue pushing the digital asset to new highs. There is only one critical resistance level before a significant 75% breakout on the weekly chart.
Dash price needs to climb above $140 to rise higher
On the weekly chart, Dash price has established a symmetrical triangle pattern and could see a breakout in the near future. The digital asset is currently trading at $130 while the trendline resistance is located at $140.
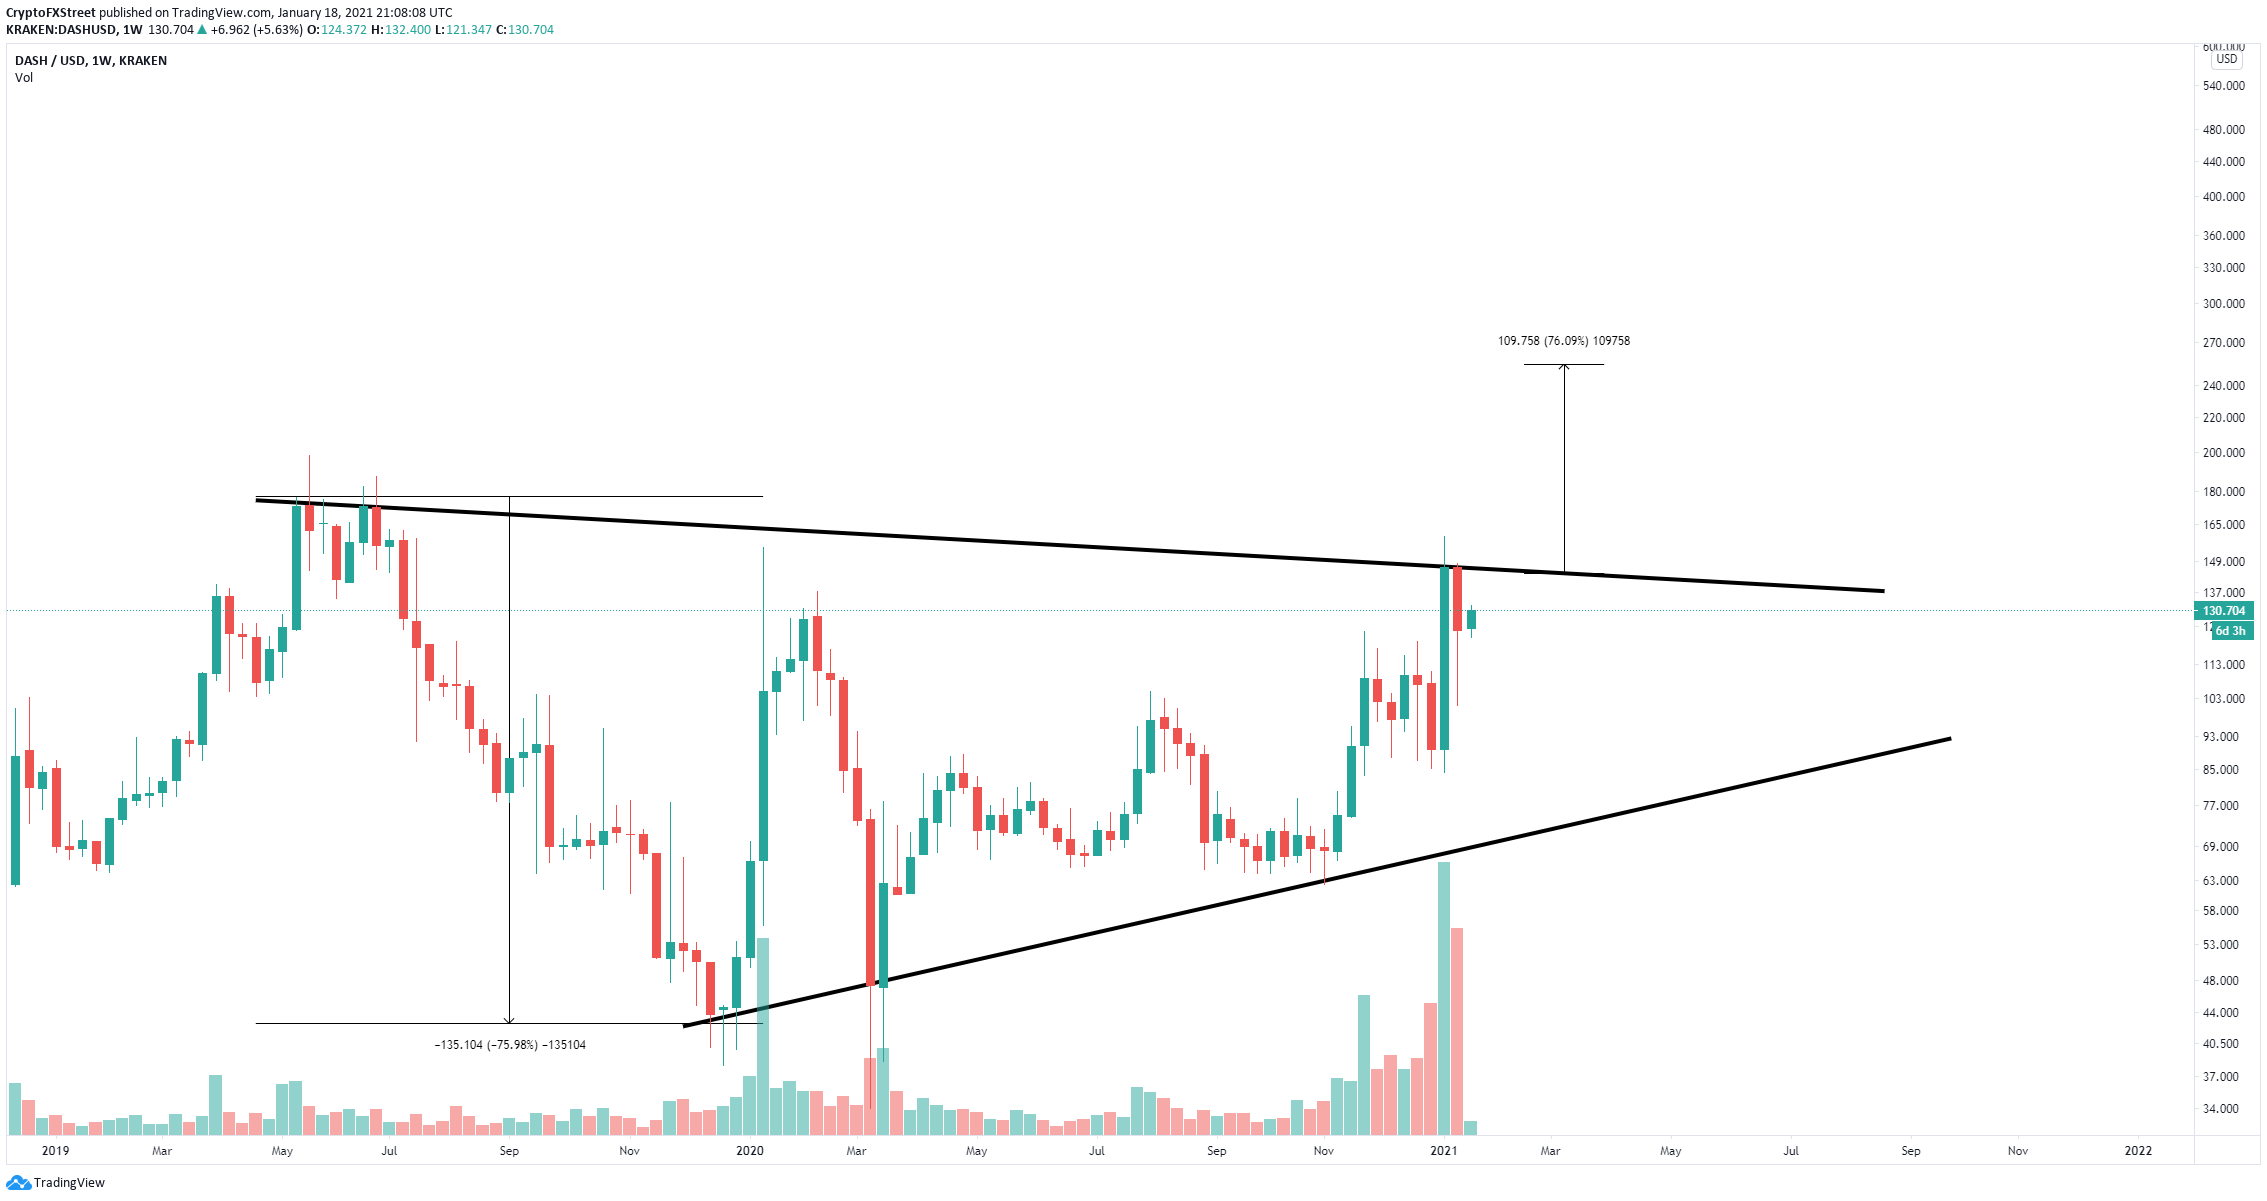
A breakout above $140 could quickly push Dash price towards $250, a 75% increase which is determined using the height of the pattern.
%20[22.09.56,%2018%20Jan,%202021]-637466011338822003.png)
DASH social volume
Additionally, the social volume of DASH has been declining notably since the peak at $154 on January 10. This decline also indicates that a potential breakout or breakdown is nearby.
However, a rejection from the top trendline at $140 could be devastating for Dash as bears can quickly push the digital asset down to the lower boundary of the triangle pattern at $70.
Author

Lorenzo Stroe
Independent Analyst
Lorenzo is an experienced Technical Analyst and Content Writer who has been working in the cryptocurrency industry since 2012. He also has a passion for trading.


