Crypto traders: Know your playground
Introduction
Crypto Trading has an unique feature unlike other trading markets: there are several exchanges in the world where you can trade the same crypto asset. This option gives investors both the good and the bad. The bad is that we need to investigate to find out which exchange is more favorable for positive returns. The good is that it is possible to increase the probability of successful trading by choosing the right crypto exchange.
Trading, in its core, is a game of probability. It is beyond the human capacity to fully know which direction a price will move in the future. As such, investors rely on probability estimates to make the best educated guess that yield the highest return.
So let's check out some characteristics of the top crypto exchanges.
Target Crypto Exchanges
I chose the following four exchanges for the study: Bitstamp, Binance, Coinbase and Kraken. All of these are good crypto exchanges with large trading volume and significant user bases.
Bitcoin is selected for analysis because this is the most popular crypto asset.
The data for analysis is ranging from 2018.01.01 to 2020.05.31. Daily return data is the main source for analysis.
Overview
The below table shows a broad view of data for daily return for each of the four exchanges.
Daily Return Data
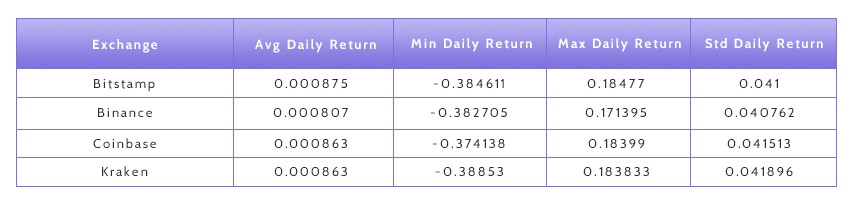
As you see in the table, Kraken's average daily return is the highest, whereas binance's return marks the lowest. When we consider the daily return only, we can postulate that trading at Kraken is likely to result in the biggest profit, even when you trade Bitcoin in the exact same manner in all four exchanges, because Kraken shows the highest expected return among them. In terms of volatility, Binance is the most stable exchange because price variation is smaller than others (please check std value).
Box plot showing Daily Return Data from the 4 exchanges.
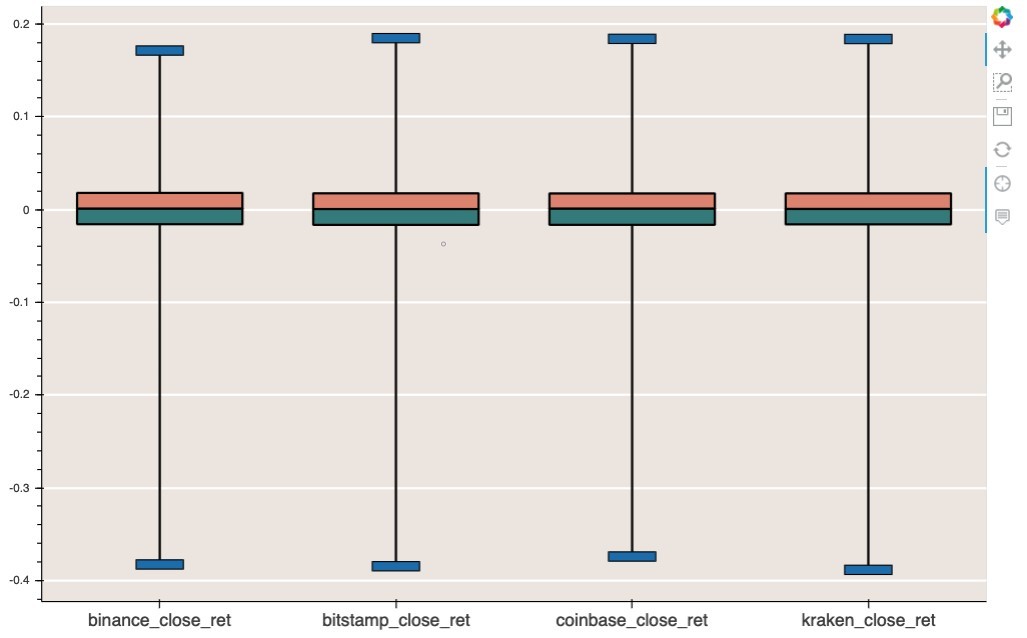
The box plot intuitively gives you a quick overview of daily return of the four exchanges.
However, the differences among the exchanges are not significant. To find insightful information that differentiates each exchange, we need to look at other data.
Daily Return Distribution
As a trader, we want to trade our crypto assets at the exchange with the highest probability for positive return. Therefore, checking only the average daily return only may not yield helpful information to identify the exchange with better profitability.
Looking at the daily return distribution is likely to give us a better guideline because the distribution can tell you the probability of the trading winning ratio.
Let's check KDE(distribution) chart to see differences
KDE Chart for 4 Exchanges
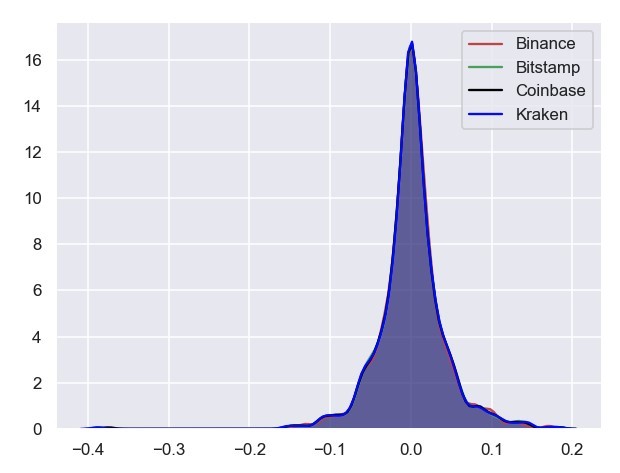
All 4 charts have similar patterns; no significant difference is found.
We may not extract meaningful insights from the chart. Let's find out the winning ratio for detailed analysis on the distribution.
Winning Ratio
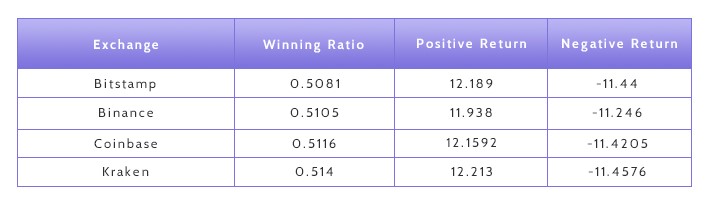
As you can see Kraken has the biggest winning ratio. This means that if you trade bitcoin, trading at Kraken will most likely result in the highest return, when compared to other exchanges. Bitstamp seems to have the worst winning ratio. Please note that this data interpretation is only viable when the comparison is done with only one variable, that is, the exchange, and all other conditions remain the same.
With that in mind, the result is consistent to the above result, the highest daily return average.
The following is a list of histograms for the four exchanges that display the aforementioned characteristics.
X-axis represents return. Therefore, a given point has positive return if it is placed on the right side of zero, negative if placed on the left. Since what we want to find out is the exchange with higher return, you want to pay attention to the area with the positive X-axis value. If a histogram shows more bars in the x-axis, that is a good sign. If those bars are taller and further away from zero when compared to other histograms, that's the exchange we want to pay attention to.
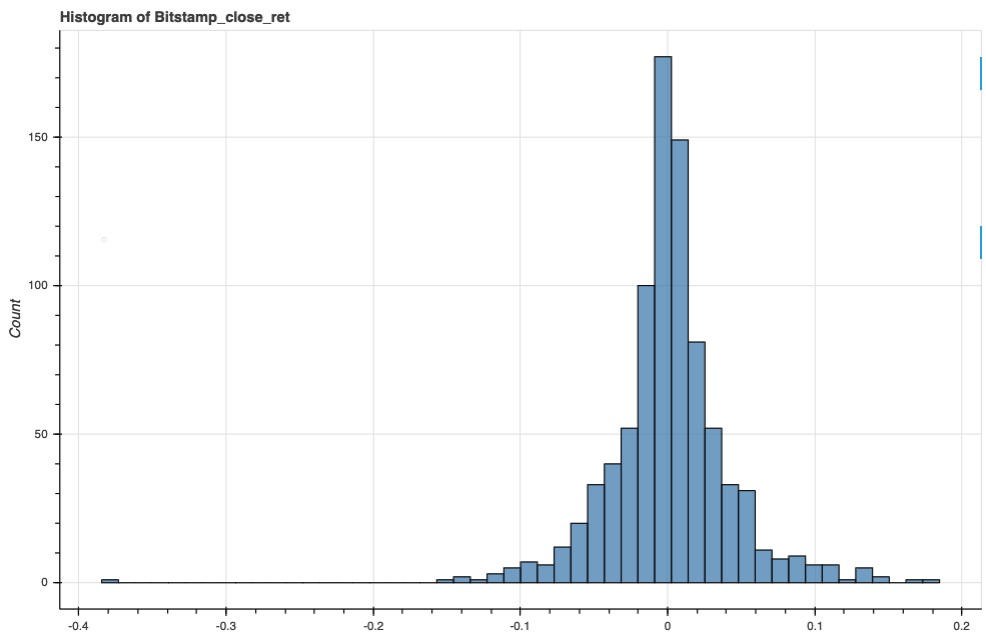
Histogram of Bitsmap
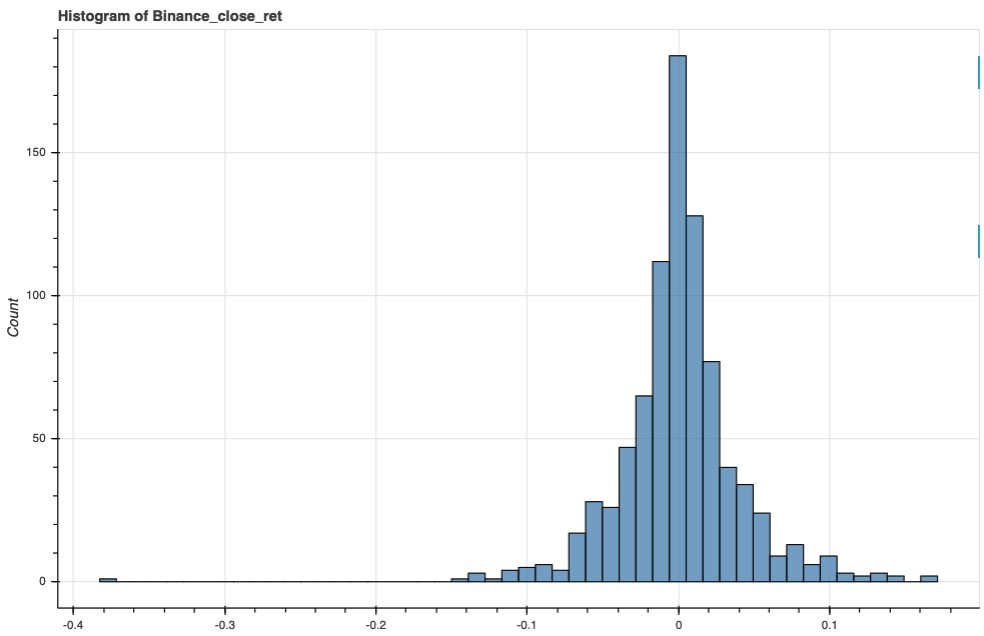
Histogram of Binance
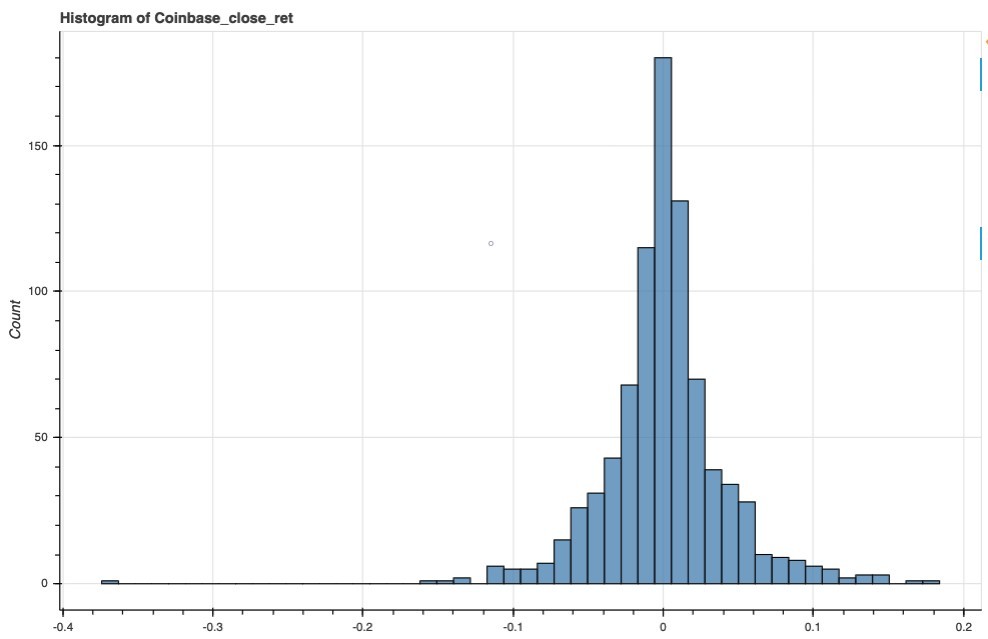
Histogram of Coinbase
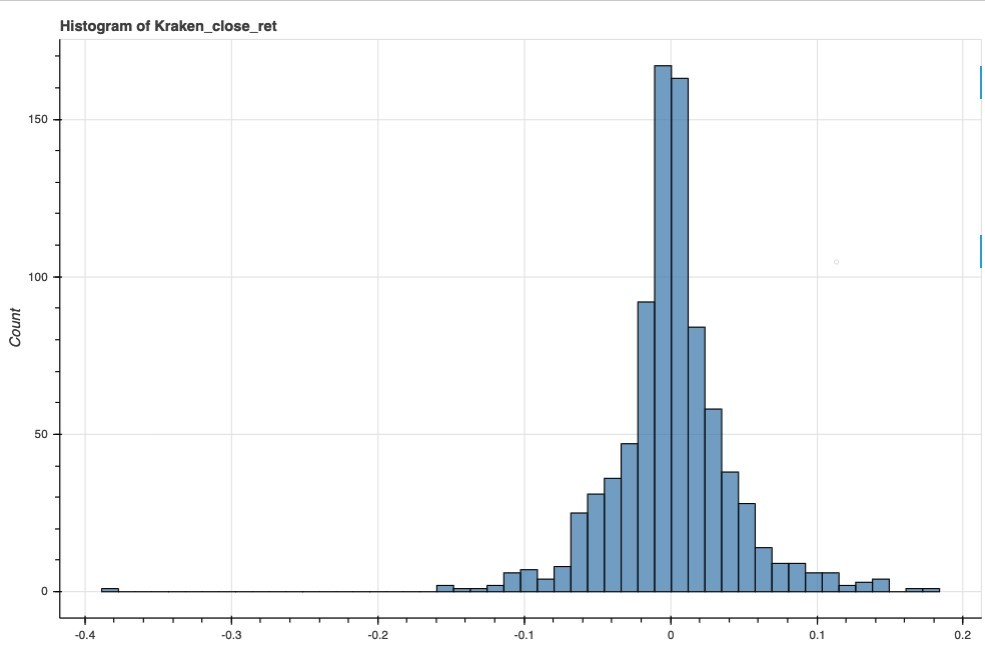
Histogram of Kraken
Comments
Before this analysis, I thought that the difference in user bases and timezone would create a clear difference between exchanges. But the result shows that there are no distinctive differences between the four exchanges in a broad view. They share similar characteristics in terms of trading. Please note that I did not consider liquidity for the study.
Regardless, it is important to remember that a small advantage makes a big difference in the trading world. Think about casinos. The house has the winning probability that is only 3% higher than that of players. However, as players play more games, that 3% produces impressive performance differences.
The result might be different depending on chosen asset, data, data processing method and so on. Nevertheless, if you are serious about trading, you really need to study your playground. That might be the first step to take to win your game.
Author

James Ahn
MoA, powered by EdenChain Partners
James Ahn, Chief of Strategy at MoA and CEO at EdenChain Partners, has 20+ years of experience in the field of IT. He has worked as CTO at CyberRenassance Inc. (Japan) and later as a representative of MHR and DeepNumbers.


