Crypto Overview: Bitcoin tops $78,000 amid US-Iran blockade – PENGU, AERO, SEI lead gains
- Bitcoin edges above $78,000 on Thursday, lifting the broader market sentiment.
- Total liquidations cross $450 million in 24 hours amid intense short positional wipeout.
- Pudgy Penguins, Aerodrome Finance, and Sei are leading gains over the last 24 hours.

Bitcoin (BTC) extends its steady recovery above $78,000 at press time on Thursday, despite complications arising from the US-Iran ceasefire. The broader market sentiment is gradually improving, while total market liquidations over the past 24 hours have crossed $450 million. Pudgy Penguins (PENGU), Aerodrome Finance (AERO), and Sei (SEI) emerge as top performers over the last 24 hours.
Short squeeze drives liquidations over $450 million amid easing sentiment
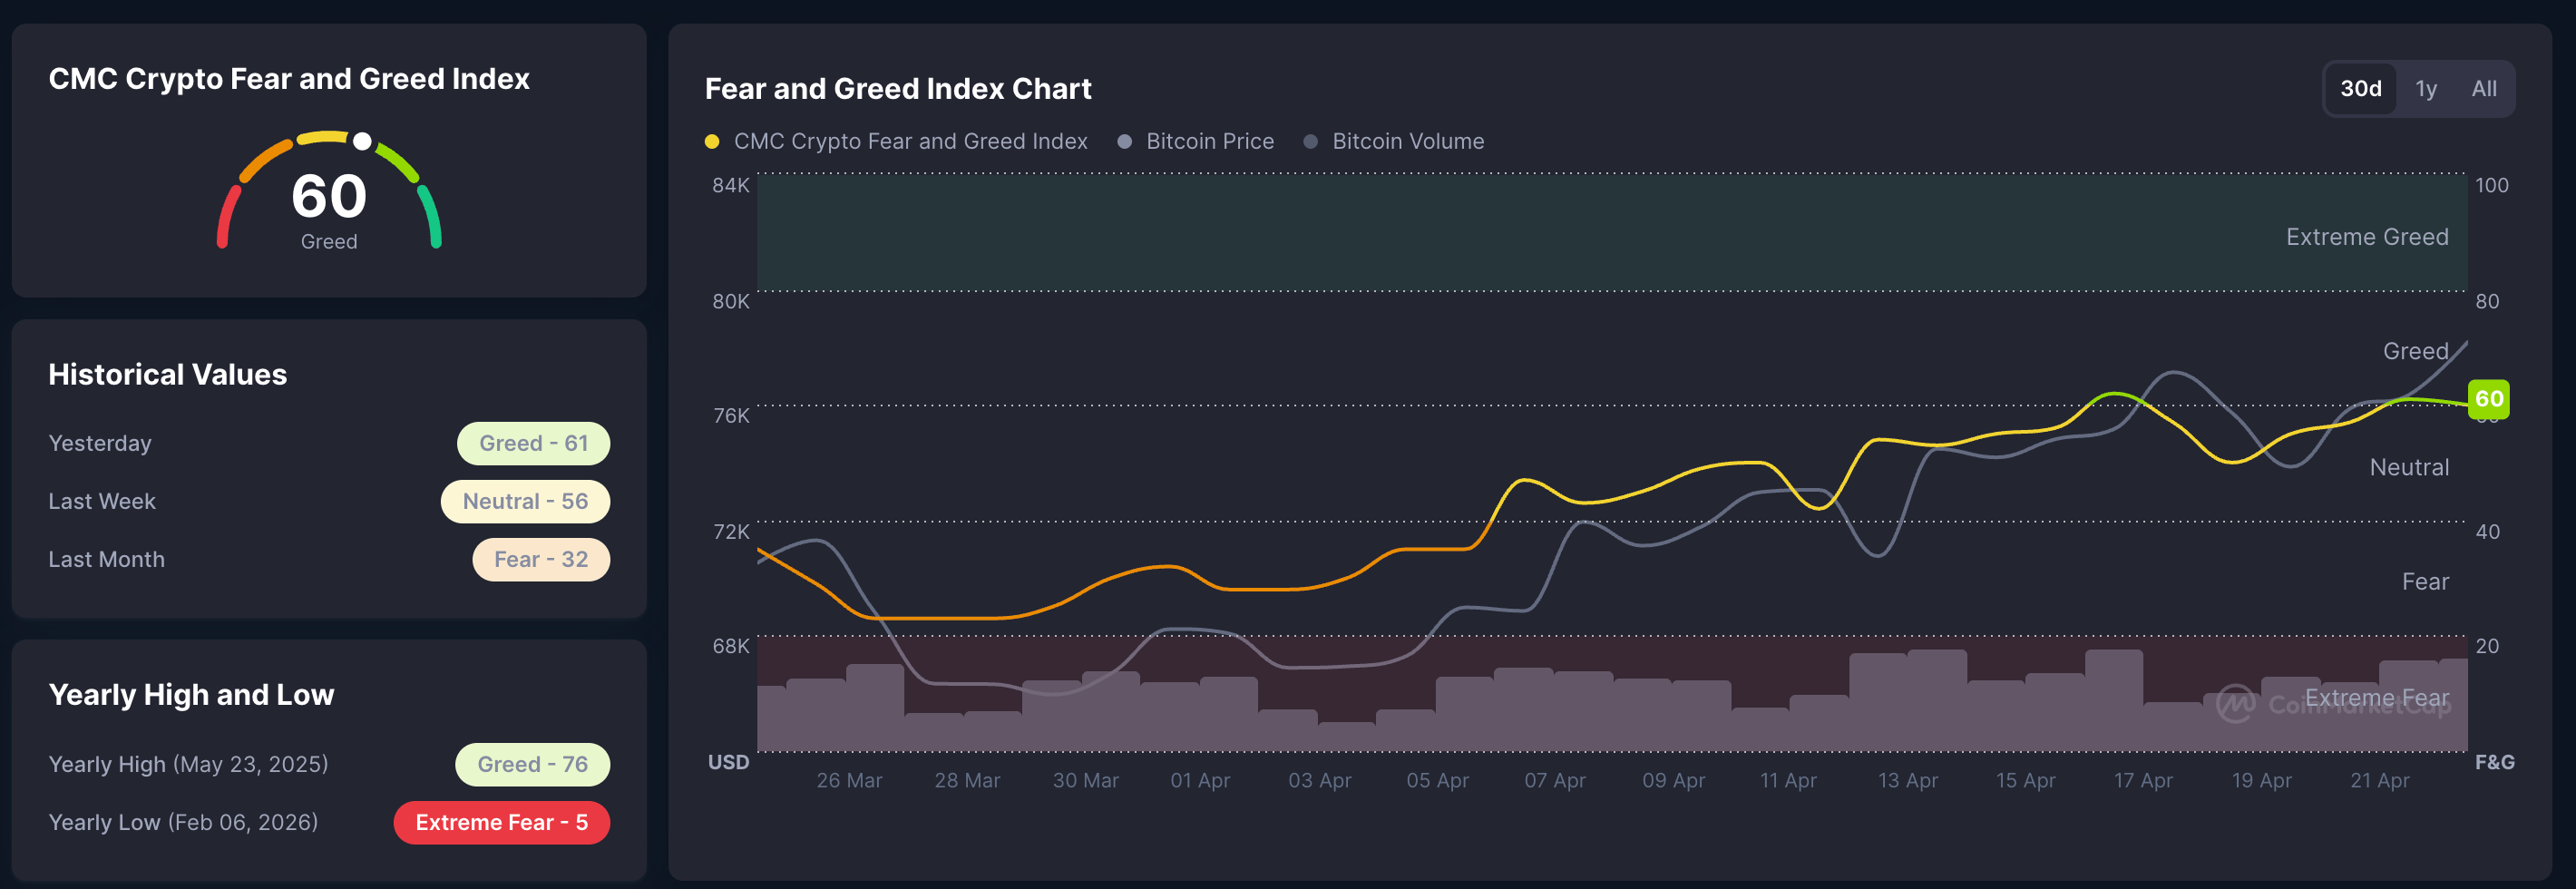
The risk-on sentiment in the cryptocurrency market recovers as the US indefinitely removes the deadline for Iran’s peace proposal, as both parties battle for control of the Strait of Hormuz. CoinMarketCap’s Fear and Greed Index stands at 60, up from 41 on April 1, signaling increased risk appetite among investors.
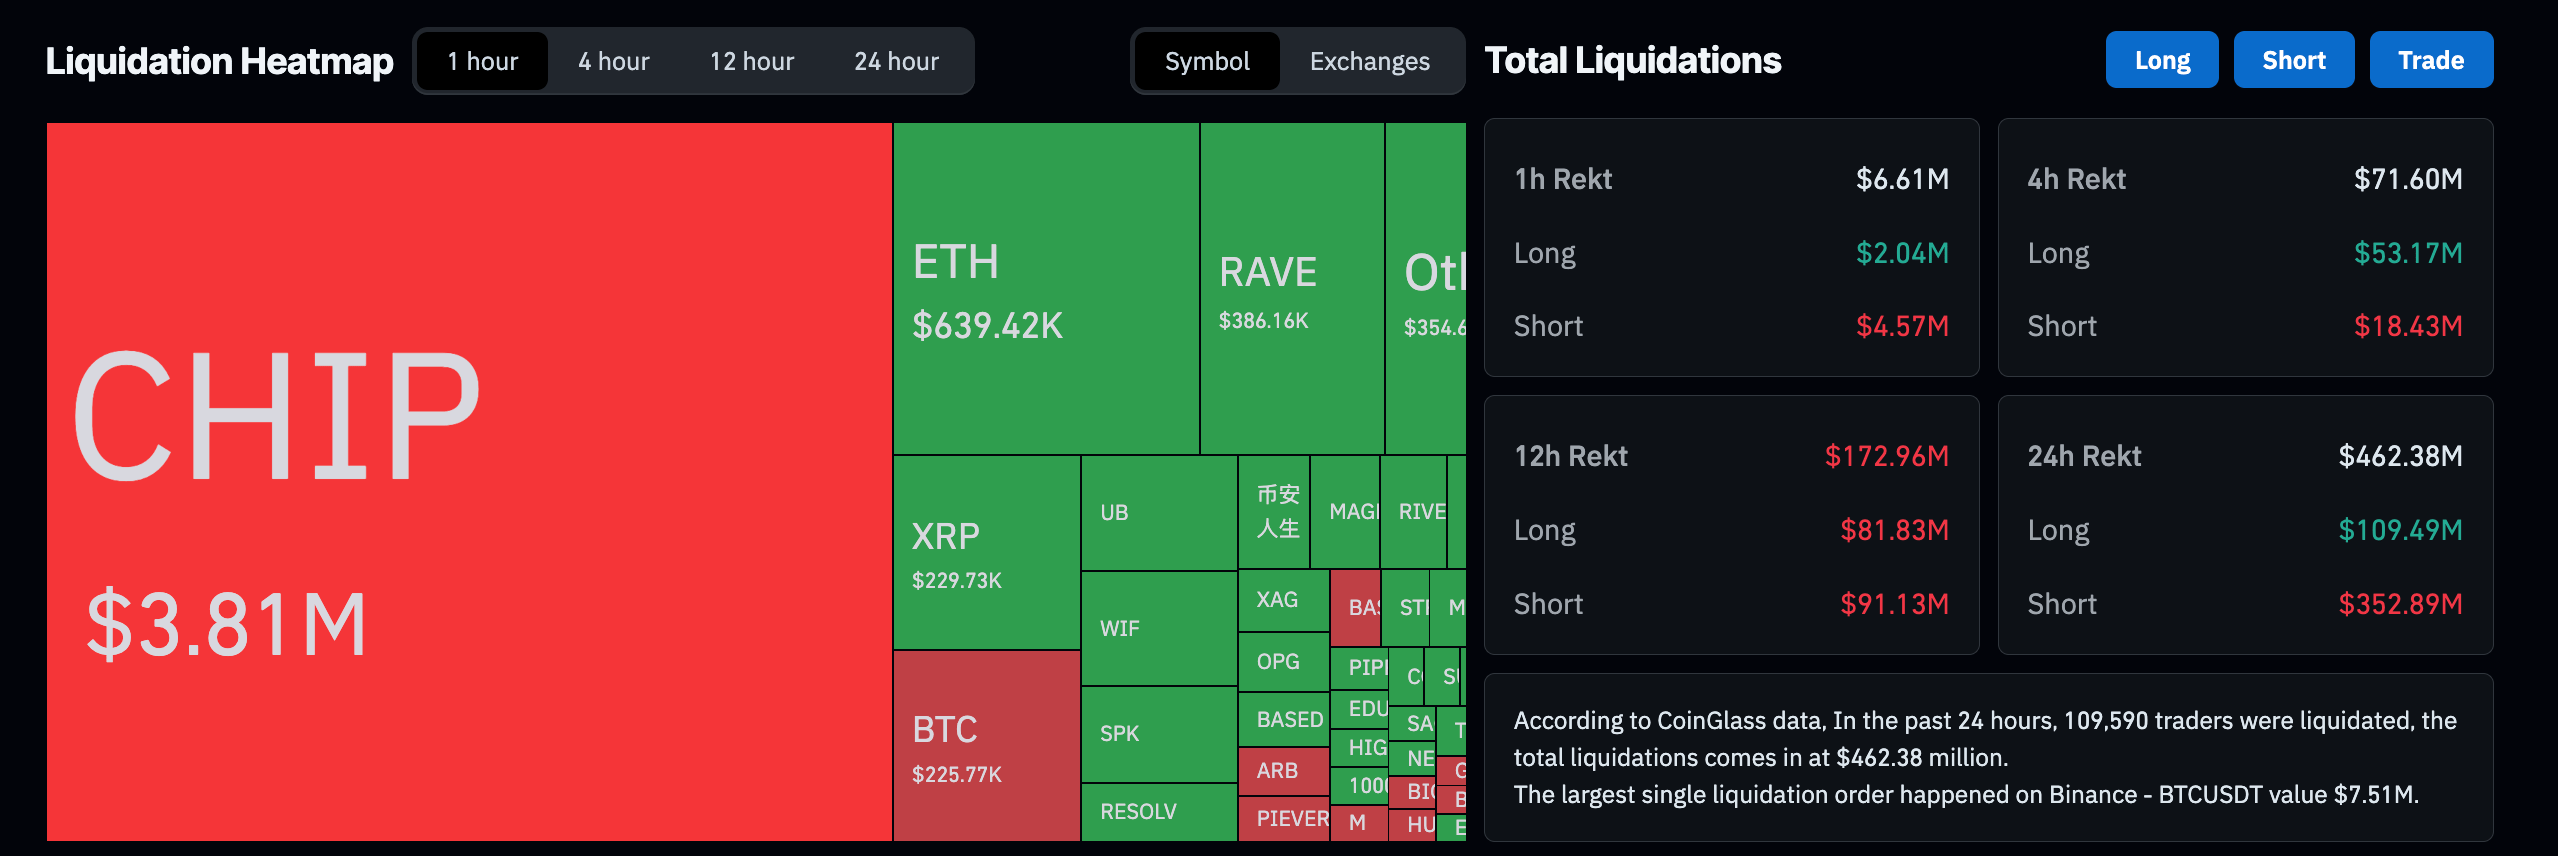
On the other hand, total liquidations of $462 million over the last 24 hours suggest a short squeeze driven by $352 million in short positional wipeout.
Technical outlook: Will PENGU, AERO, and SEI extend gains?
PENGU extends recovery for the fourth consecutive day this week, with over 2% gains at press time on Thursday. The meme coin holds a constructive bullish bias as it sits above the 50-day and 100-day Exponential Moving Averages (EMAs) at $0.0072 and $0.0081, respectively.
The Moving Average Convergence Divergence (MACD) histogram is marginally above its signal line, and the Relative Strength Index (RSI) at 65 suggests firm buying pressure, though the pair is now approaching an initial Fibonacci resistance cluster, with the 38.2% retracement aligning just overhead at $0.0086.
A decisive close above the 50% retracement level at $0.0085, measured from the $0.0137 to $0.0053 downswing, serves as the immediate resistance. A break above this level could unlock the path toward the 200-day EMA at $0.0112, coinciding with the 78.6% Fibonacci retracement level.
If PENGU slips below the 100-day EMA at $0.0082, immediate support is provided by the 50-day EMA at $0.0072, with additional demand emerging at the 23.6% Fibonacci retracement at $0.0073.
Aerodrome Finance takes a breather at press time on Thursday, after an 11% jump the previous day. AERO retains a constructive near-term bias after reclaiming key levels, including the 50-day and 100-day EMAs at $0.3638 and $0.4087, respectively, while also staying over the 50% Fibonacci retracement at $0.4159, a cluster that underpins the latest advance.
Momentum conditions support the upside, with the RSI hovering at 59 and the MACD line in positive territory above its signal line, hinting that bullish pressure remains in play as long as price holds above this support band.
On the topside, initial resistance is at the 200-day EMA at $0.5175, which reinforces a broader resistance zone ahead.
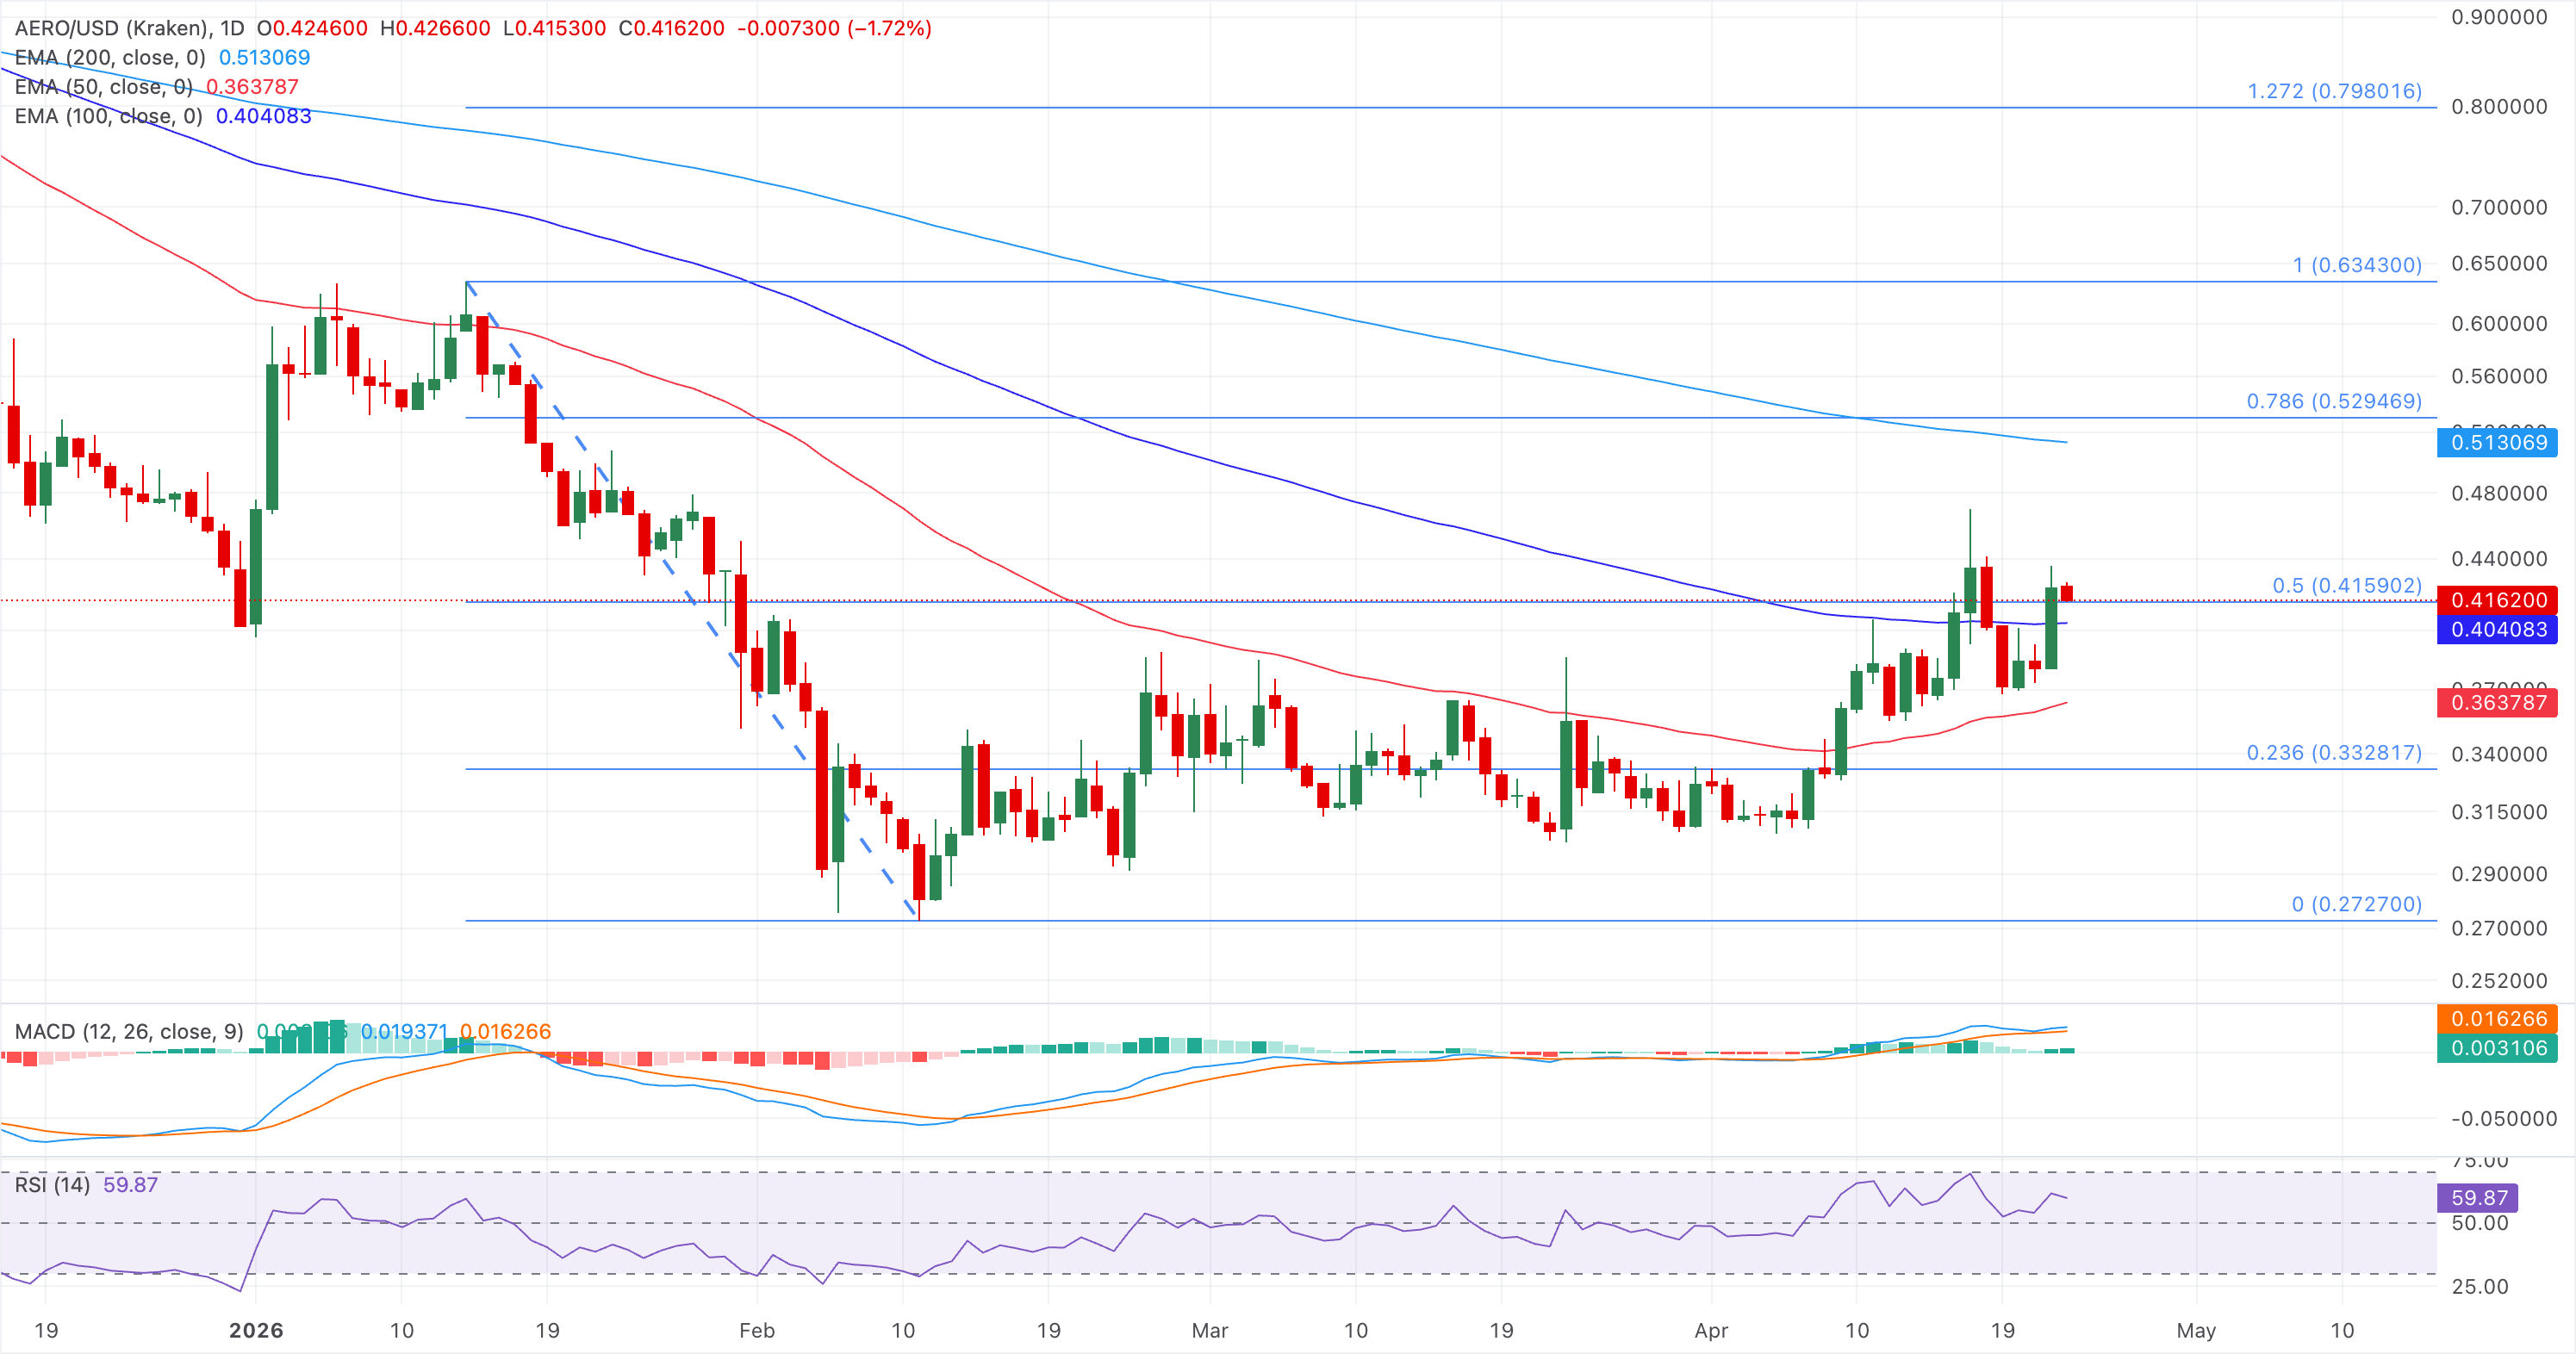
On the downside, immediate support lies at the 100-day EMA at $0.4087, and a break below this level would expose the 50-day EMA at $0.3638.
Sei holds steady after a three-day recovery run, testing the 50-day EMA at $0.0613 at press time on Thursday. SEI holds over the broken descending trendline, tilting the near-term tone slightly constructive while it remains capped well beneath the 100-day EMA at $0.0783 and the longer-term 200-day EMA near $0.1160.
Momentum is supportive, with the RSI hovering at 58 and the MACD line advancing above its signal line, hinting that buyers retain the upper hand as long as price stays above the recent breakout area.
Looking up, a push above the 50-day EMA could target the $0.0714 resistance level, followed by the 100-day EMA near $0.0783, while the 200-day EMA around $0.1160 reinforcing a broader bearish structure above.
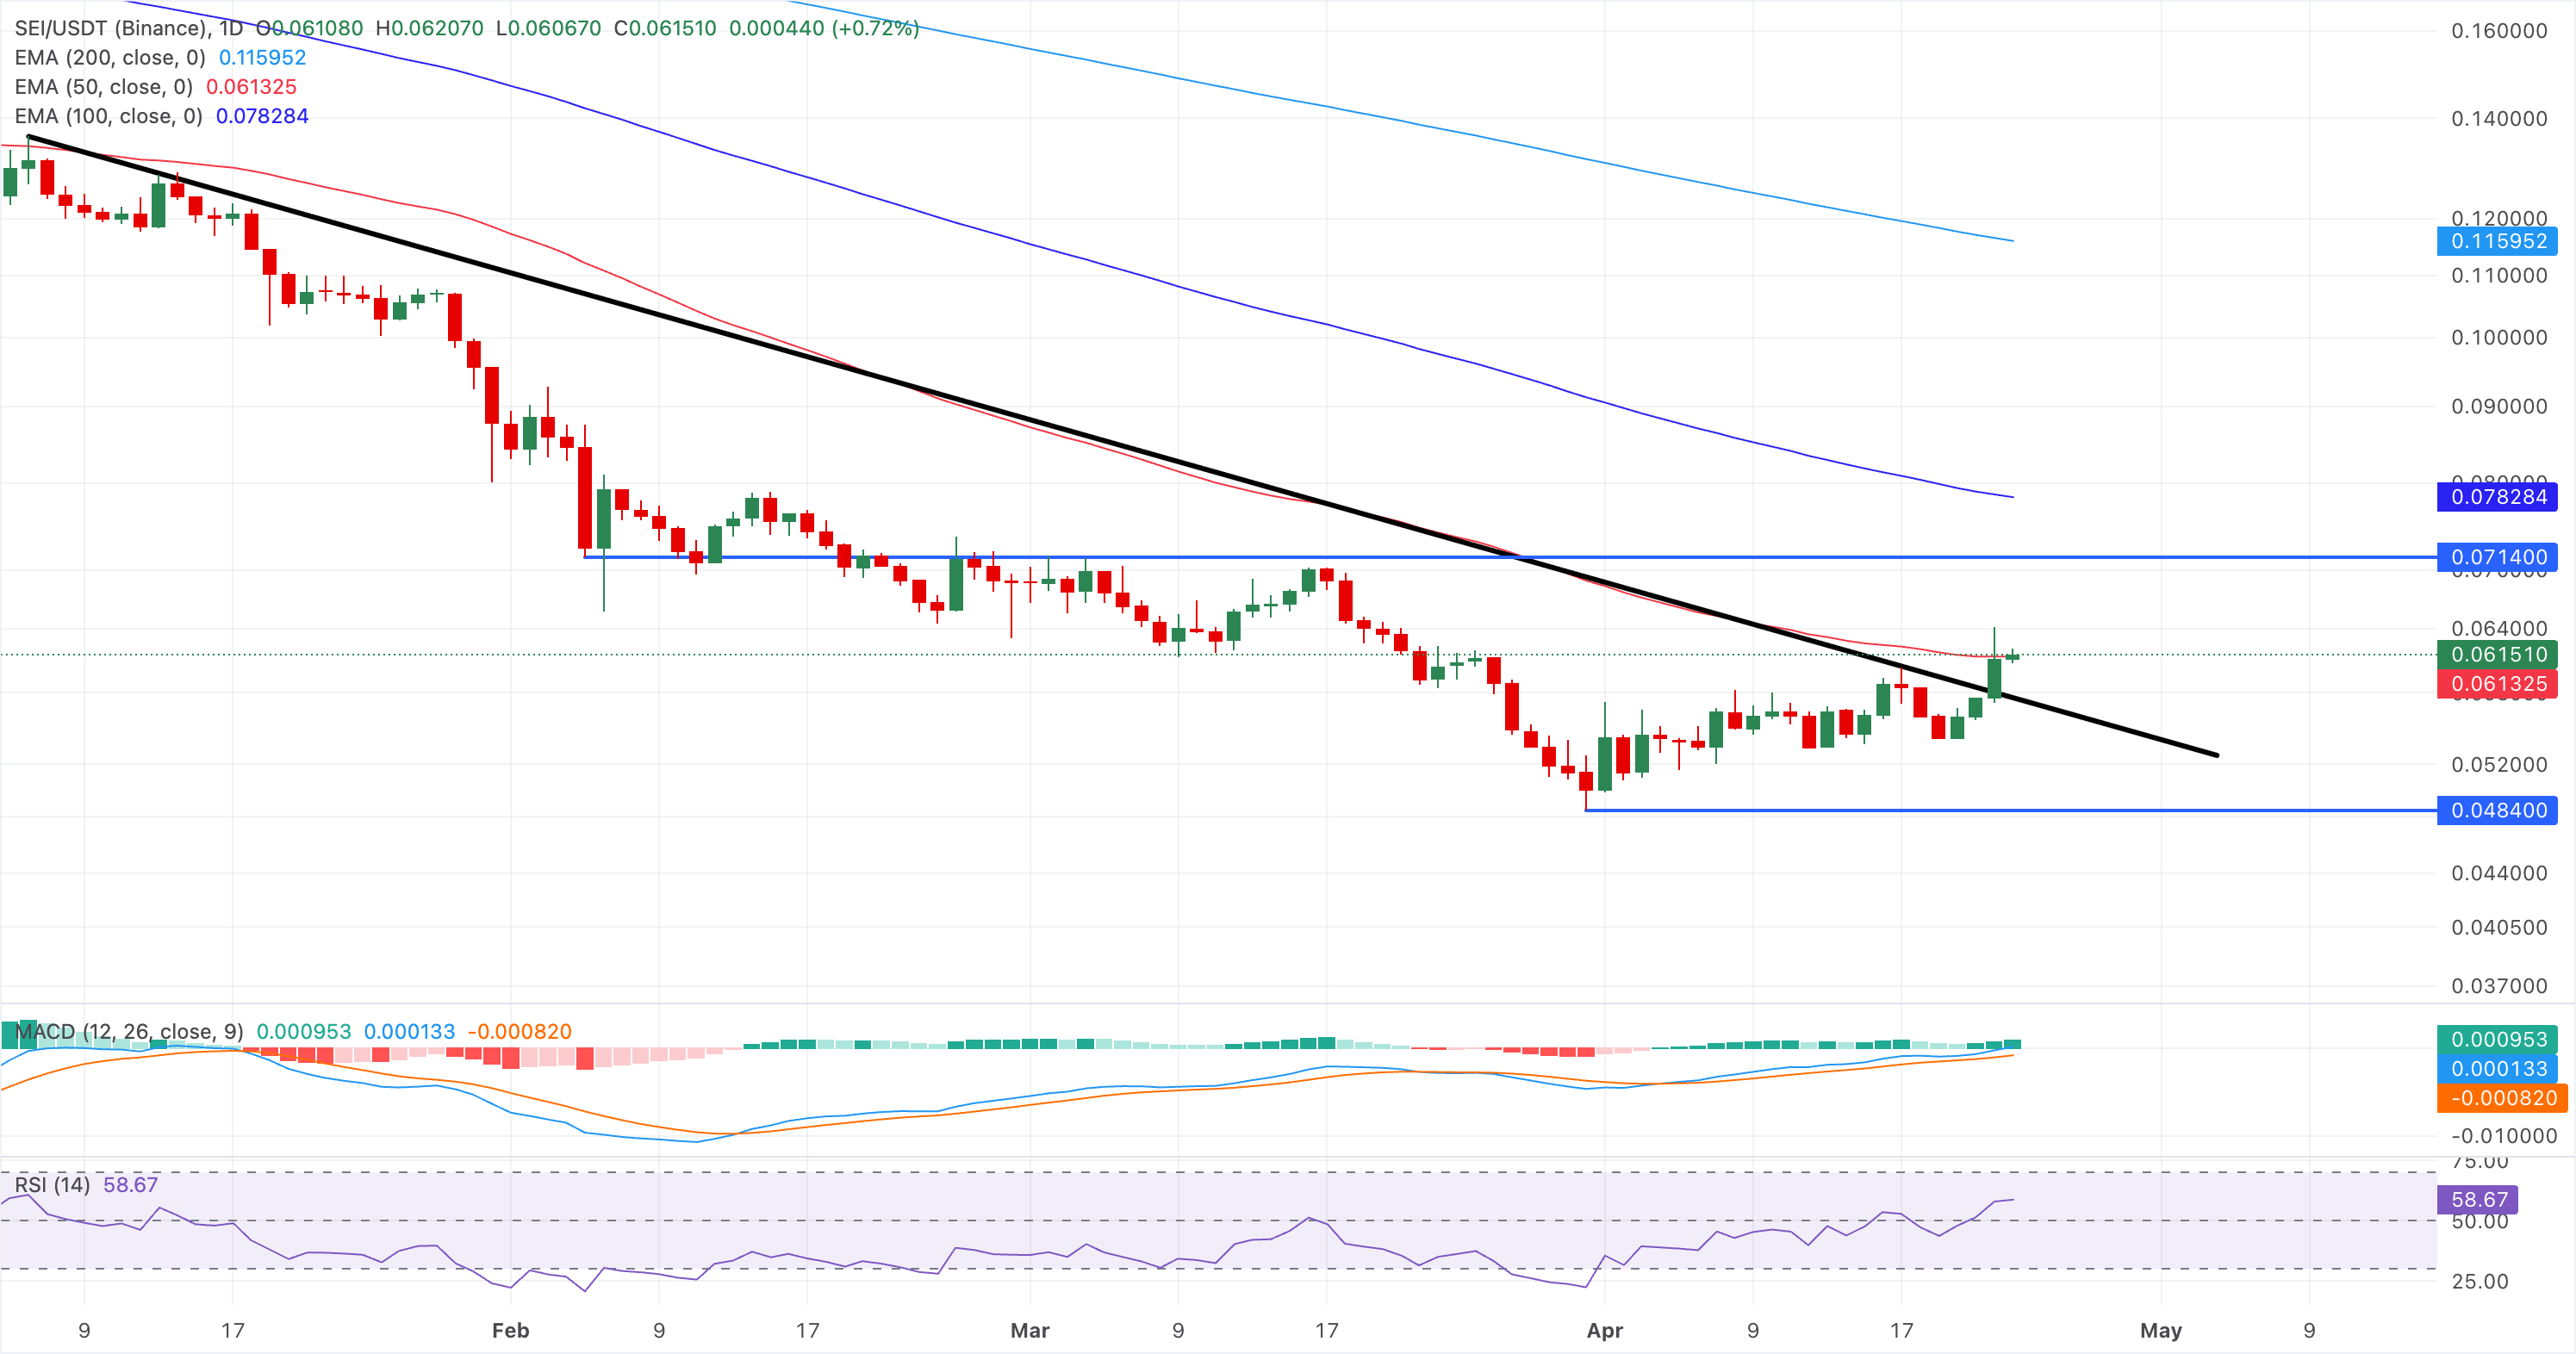
On the flip side, immediate support lies at the broken descending trendline at $0.0604.
(The technical analysis of this story was written with the help of an AI tool.)
Author

Vishal Dixit
FXStreet
Vishal Dixit holds a B.Sc. in Chemistry from Wilson College but found his true calling in the world of crypto.



