Crypto Market Overview: Bitcoin recovers on Kevin Warsh optimism – Jupiter, Morpho lead rally
- Bitcoin rises above $60,000 on Thursday as Kevin Warsh eases rate hike fears.
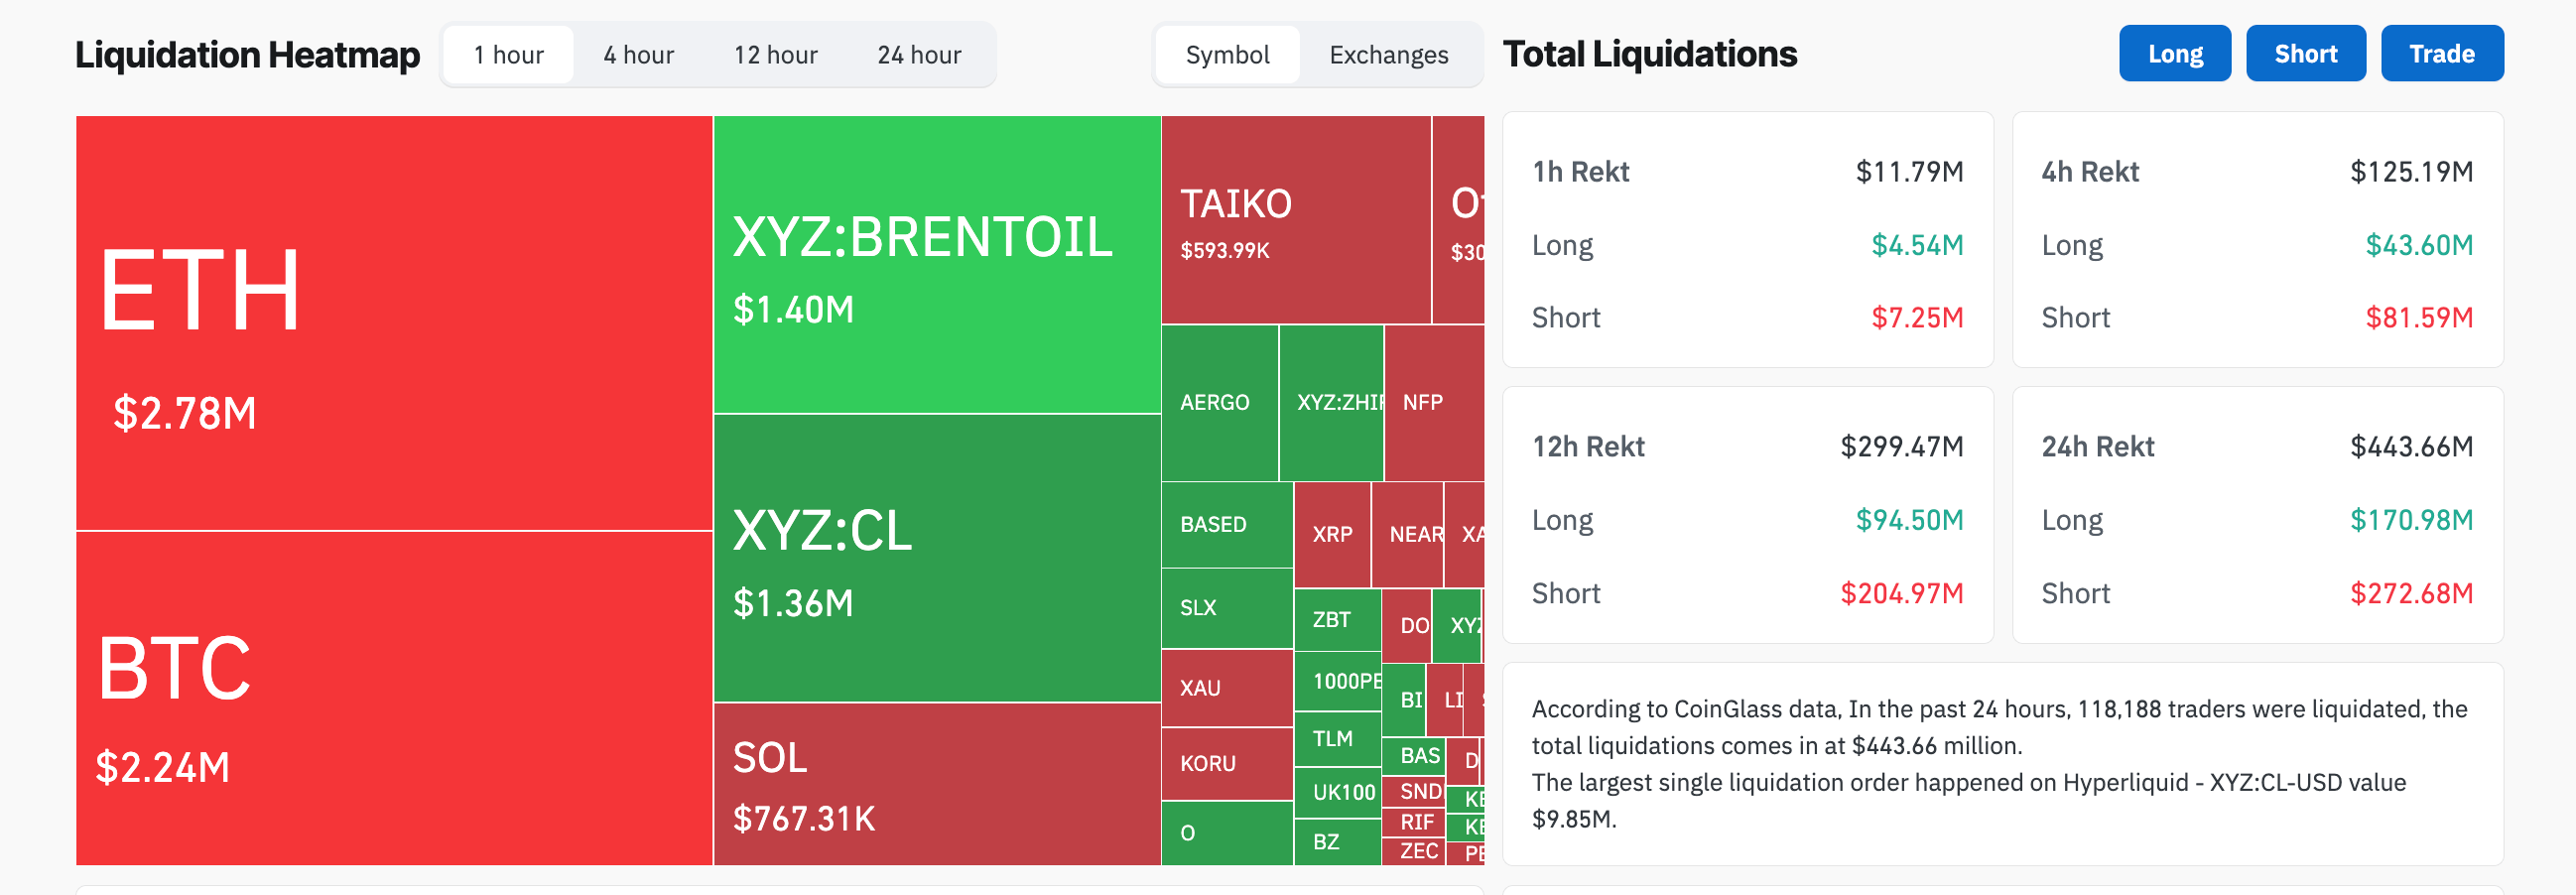
- Total liquidations exceed $400 million in 24 hours, primarily driven by $272 million in short liquidations, suggesting a buy-side resurgence.
- Jupiter and Morpho emerge as top gainers over the last 24 hours.

The broader cryptocurrency market is easing downside pressure, with US Federal Reserve Chairman Kevin Warsh's optimism about US growth driving Bitcoin (BTC) above $60,000. Short liquidations outpace long liquidations over the last 24 hours, suggesting renewed near-term buying strength, while Jupiter (JUP) and Morpho (MORPHO) lead gains during the same period.
Kevin Warsh’s optimism provides minor relief to the crypto market
US Fed Chair Kevin Warsh reaffirmed that returning inflation to 2% remains the Fed's top priority at the ECB Forum in Sintra. In addition, Warsh recognized that inflation risks and short-term inflation expectations had eased in recent weeks, but he reiterated that “prices remain too high”, as previously reported by FXStreet.
Amid stirring optimism over the “prices too high” comment, Gold recovered above $4,000, and Bitcoin reclaimed $60,000 on Wednesday. CoinGlass data reaffirms the mild recovery across the crypto market, with short liquidations of $272 million outpacing long liquidations of $170 million over the last 24 hours, as buyers regain strength.
Bitcoin hovers over thin ice around $60,000
Bitcoin hovers above $60,000 on Thursday, following a 2% recovery the previous day. The King Crypto maintains a broadly bearish near-term bias, with spot trading well below the 50-day Exponential Moving Average (EMA) at $66,146 and the 200-day EMA near $75,948.
From a technical perspective, BTC price continues to consolidate, with the June 25 low at $58,115 serving as the bottom support floor, while price faces headwinds above $60,000. A decisive follow-through on Thursday could extend recovery toward the $65,000 round figure.
That said, the Moving Average Convergence Divergence (MACD) rises above its signal line after a brief consolidation, suggesting renewed buying pressure. Meanwhile, the Relative Strength Index (RSI) near 38 still hints at weak, only mildly recovering momentum.
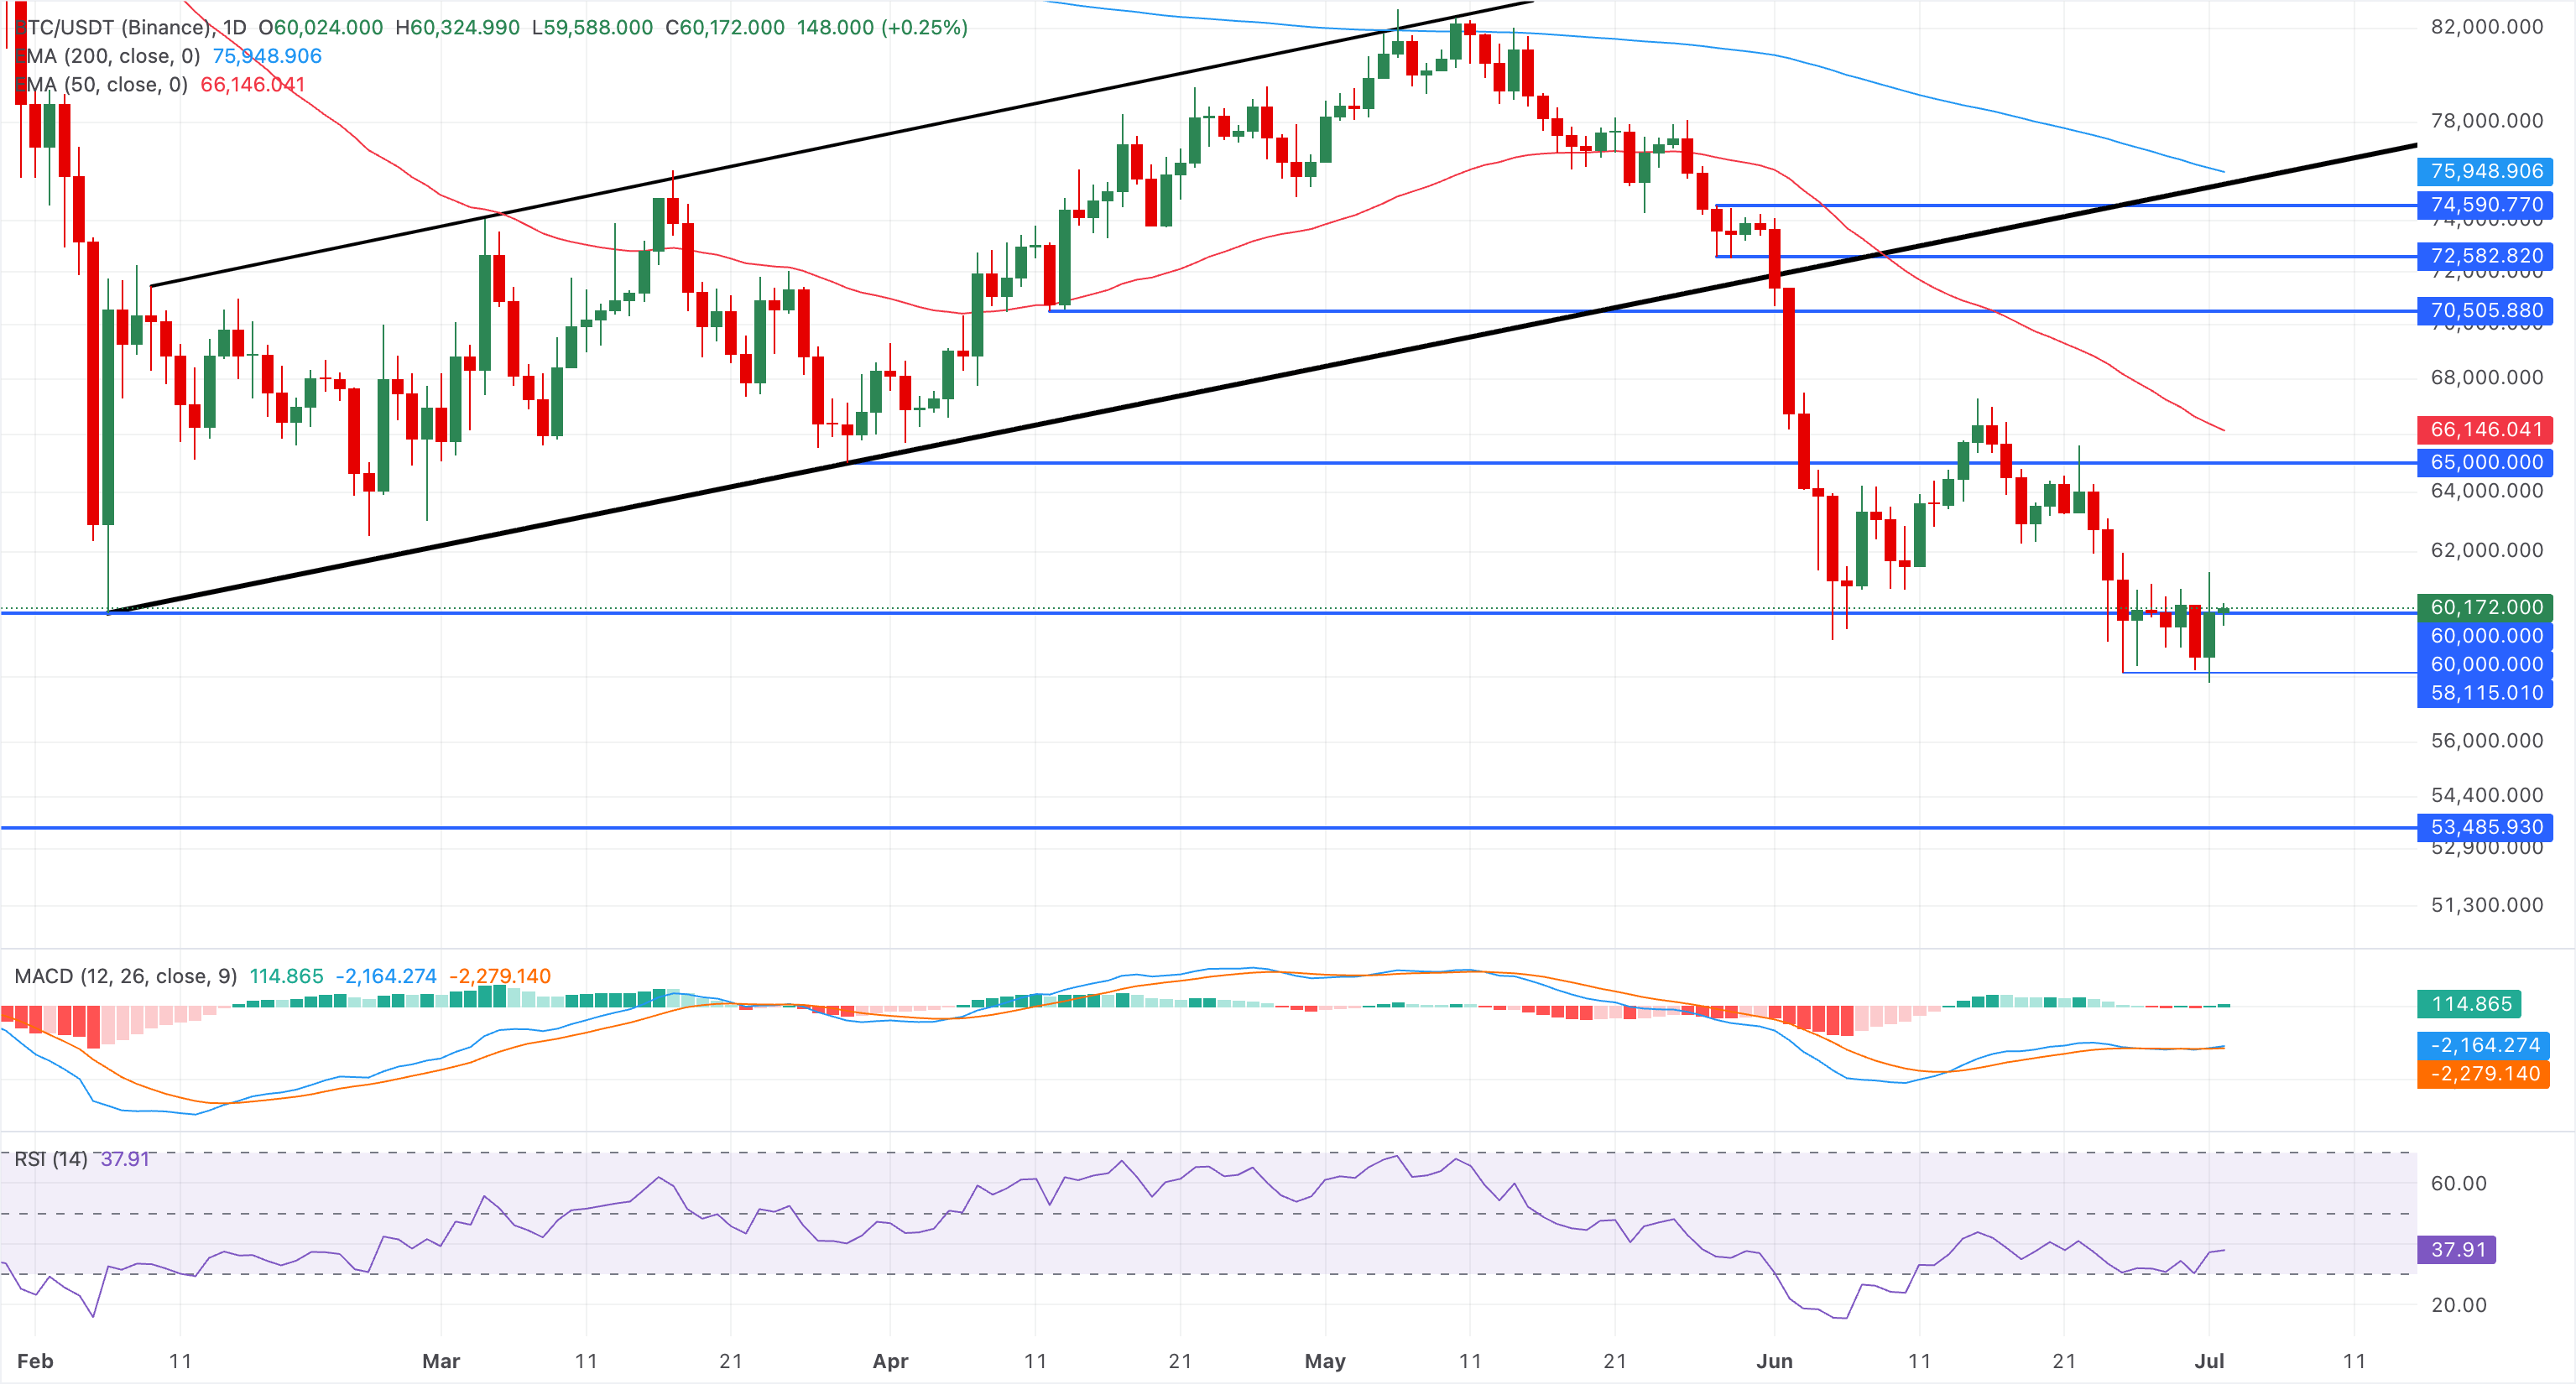
On the downside, immediate demand is seen at the horizontal support zone clustered around $60,000, followed by the $58,115 support floor, where buyers may attempt to slow the decline.
Jupiter and Morpho ready to extend gains
Jupiter extends gains on Thursday, following a 10% surge the previous day. With a bullish near-term bias, price sits above both the 50-day and 200-day EMAs, clustered around $0.1991 and $0.2199, respectively.
JUP is testing a reclaimed downward resistance trend line at $0.2377, suggesting a potential transition into a more constructive phase. The resistance trendline coincides near the 78.6% Fibonacci retracement level at $0.2406, measured over the downswing from $0.2766 to $0.1444.
A decisive close above $0.2406 could test the previous swing high around $0.2766, followed by the 127.2% Fibonacci extension level at $0.3300.
The RSI near 64 and a positive, mildly rising Moving Average Convergence Divergence (MACD) line above zero hint that upside momentum remains in play.
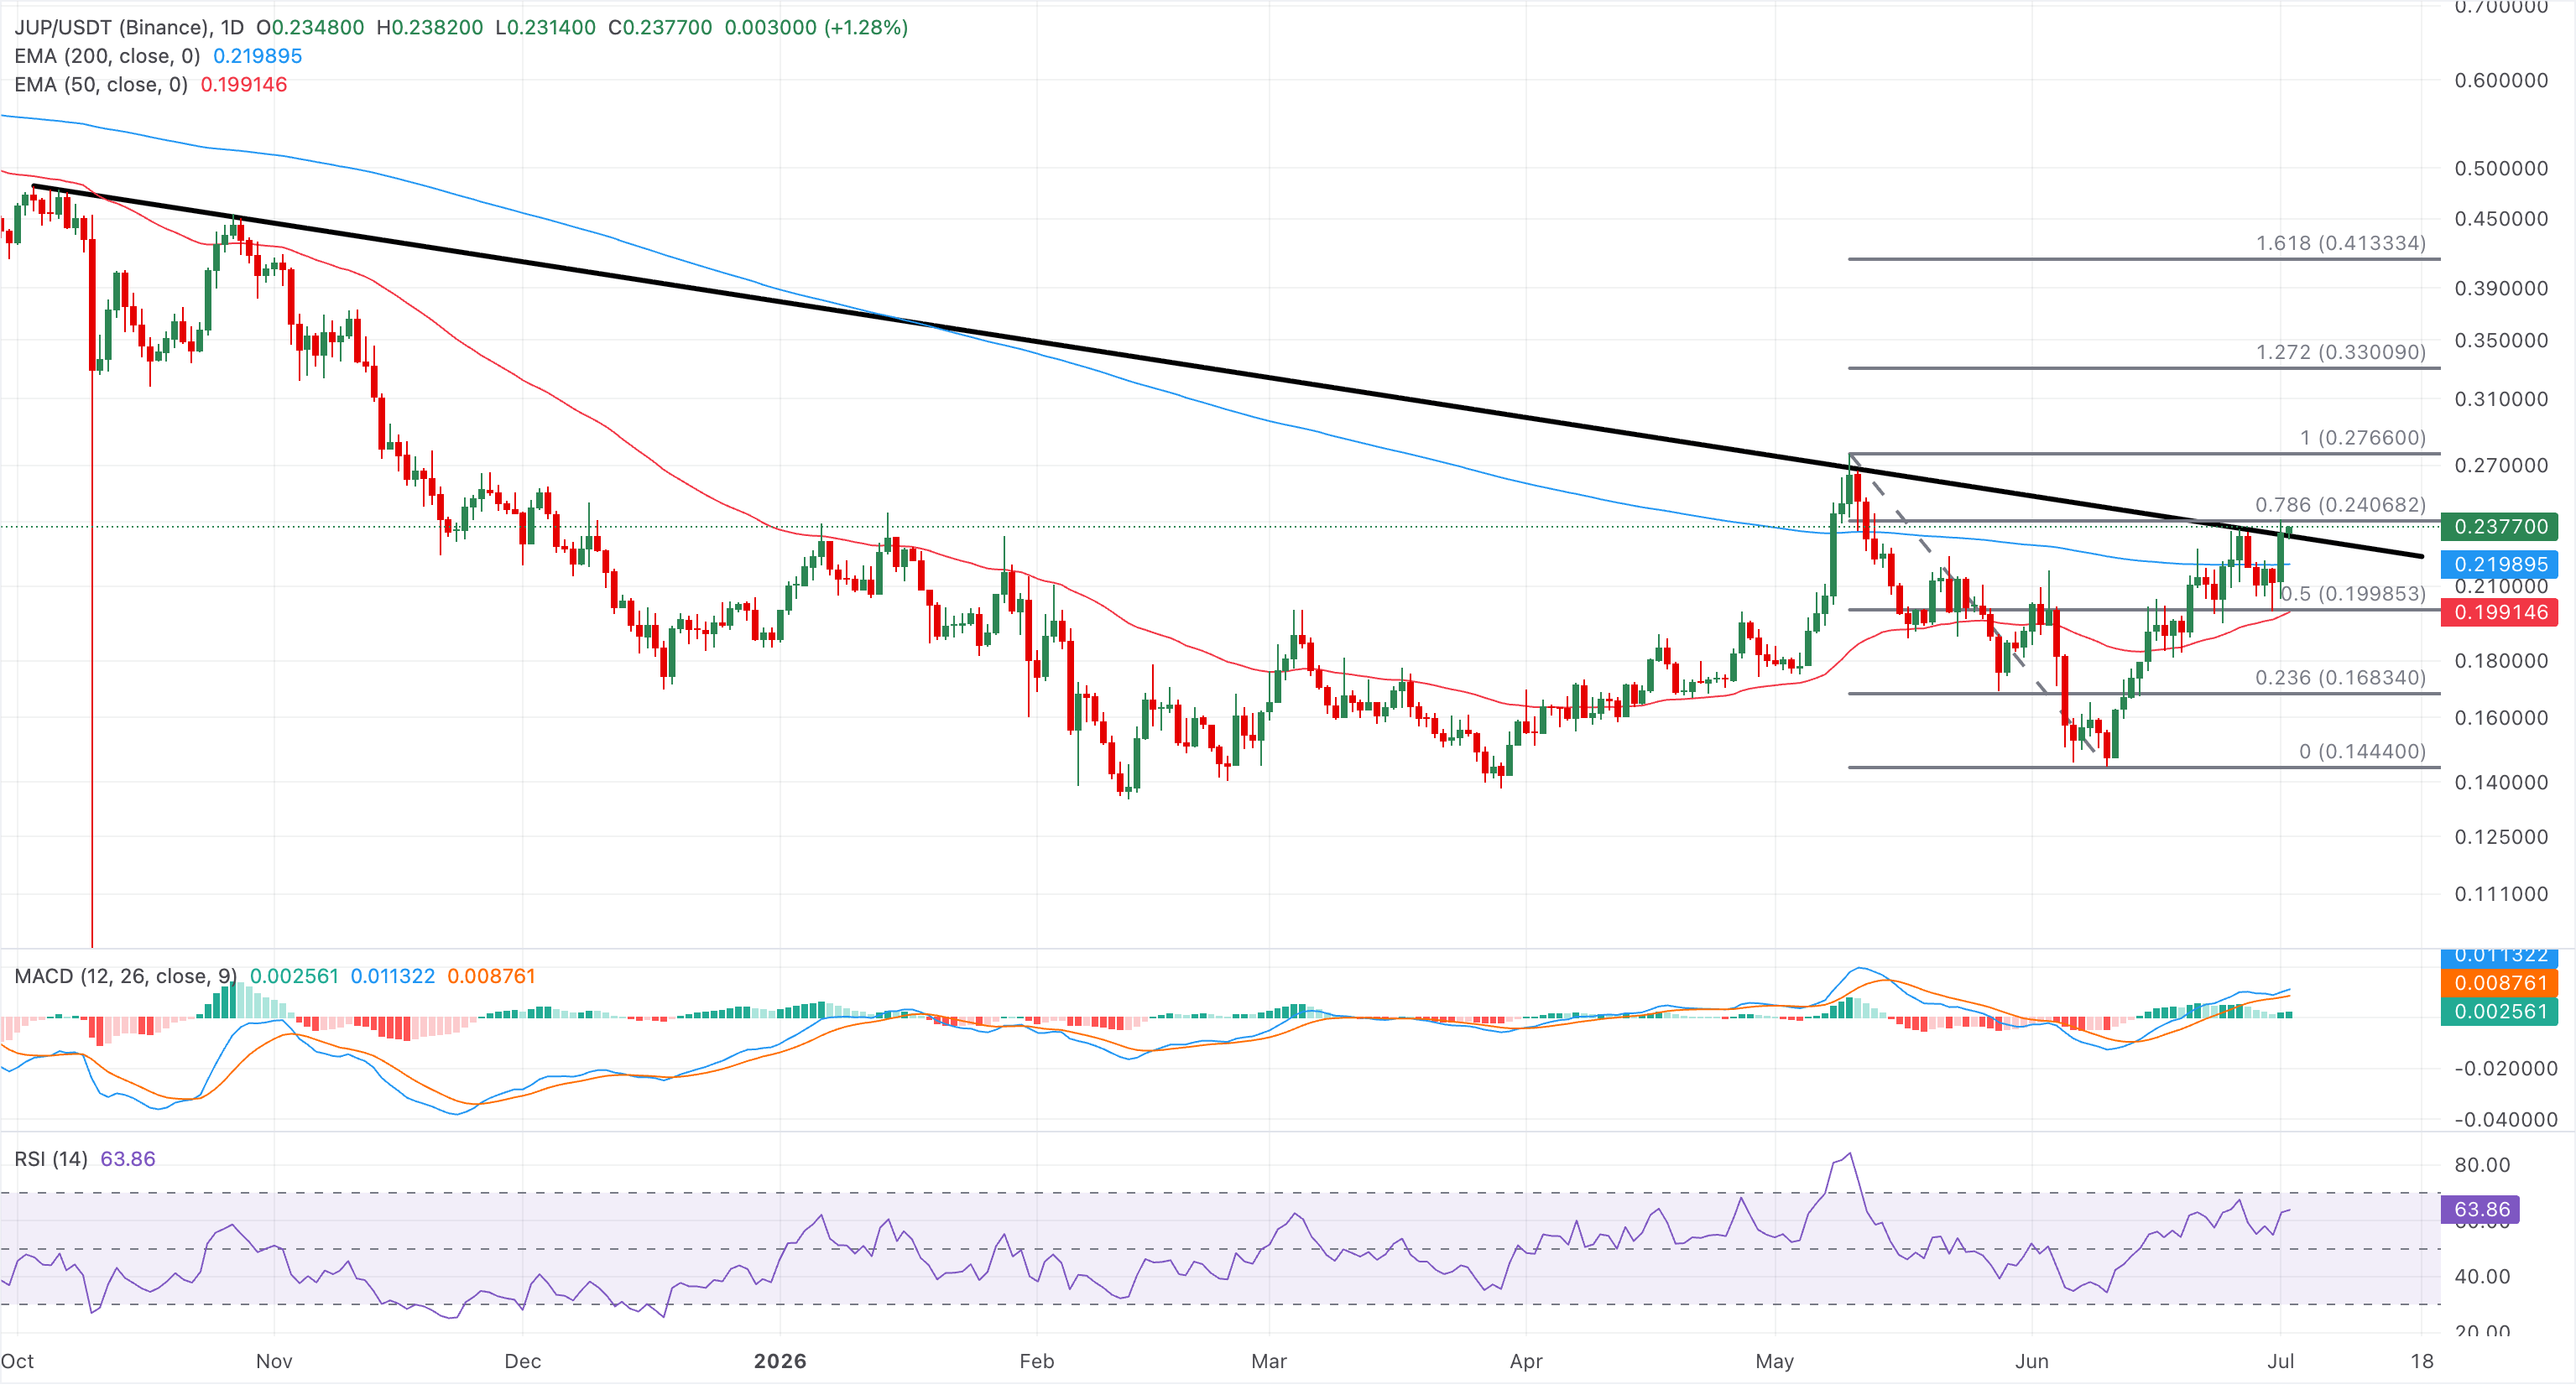
Looking down, initial support is seen at the trendline pivot around $0.2377, followed by the 200-day EMA at $0.2199, and then deeper support at the 50% retracement level at $0.1998, near the 50-day EMA at $0.1991.
On the other hand, Morpho shows a clear recovery trend of over 35% from last week, bouncing off its 200-day EMA at $1.64. At the time of writing, MORPHO is up roughly 4% on Thursday, extending the 9% gains from the previous day.
The recovery run approaches an overhead barrier near $2.24, which previously capped two bullish attempts. If MORPHO clears this resistance, the uptrend could test an ascending resistance trendline near $2.56.
The MACD and signal line show a recovery, with expanding positive histograms suggesting buying pressure is returning, while the RSI is at 65, reaffirming renewed buying strength, though conditions risk approaching overbought levels.
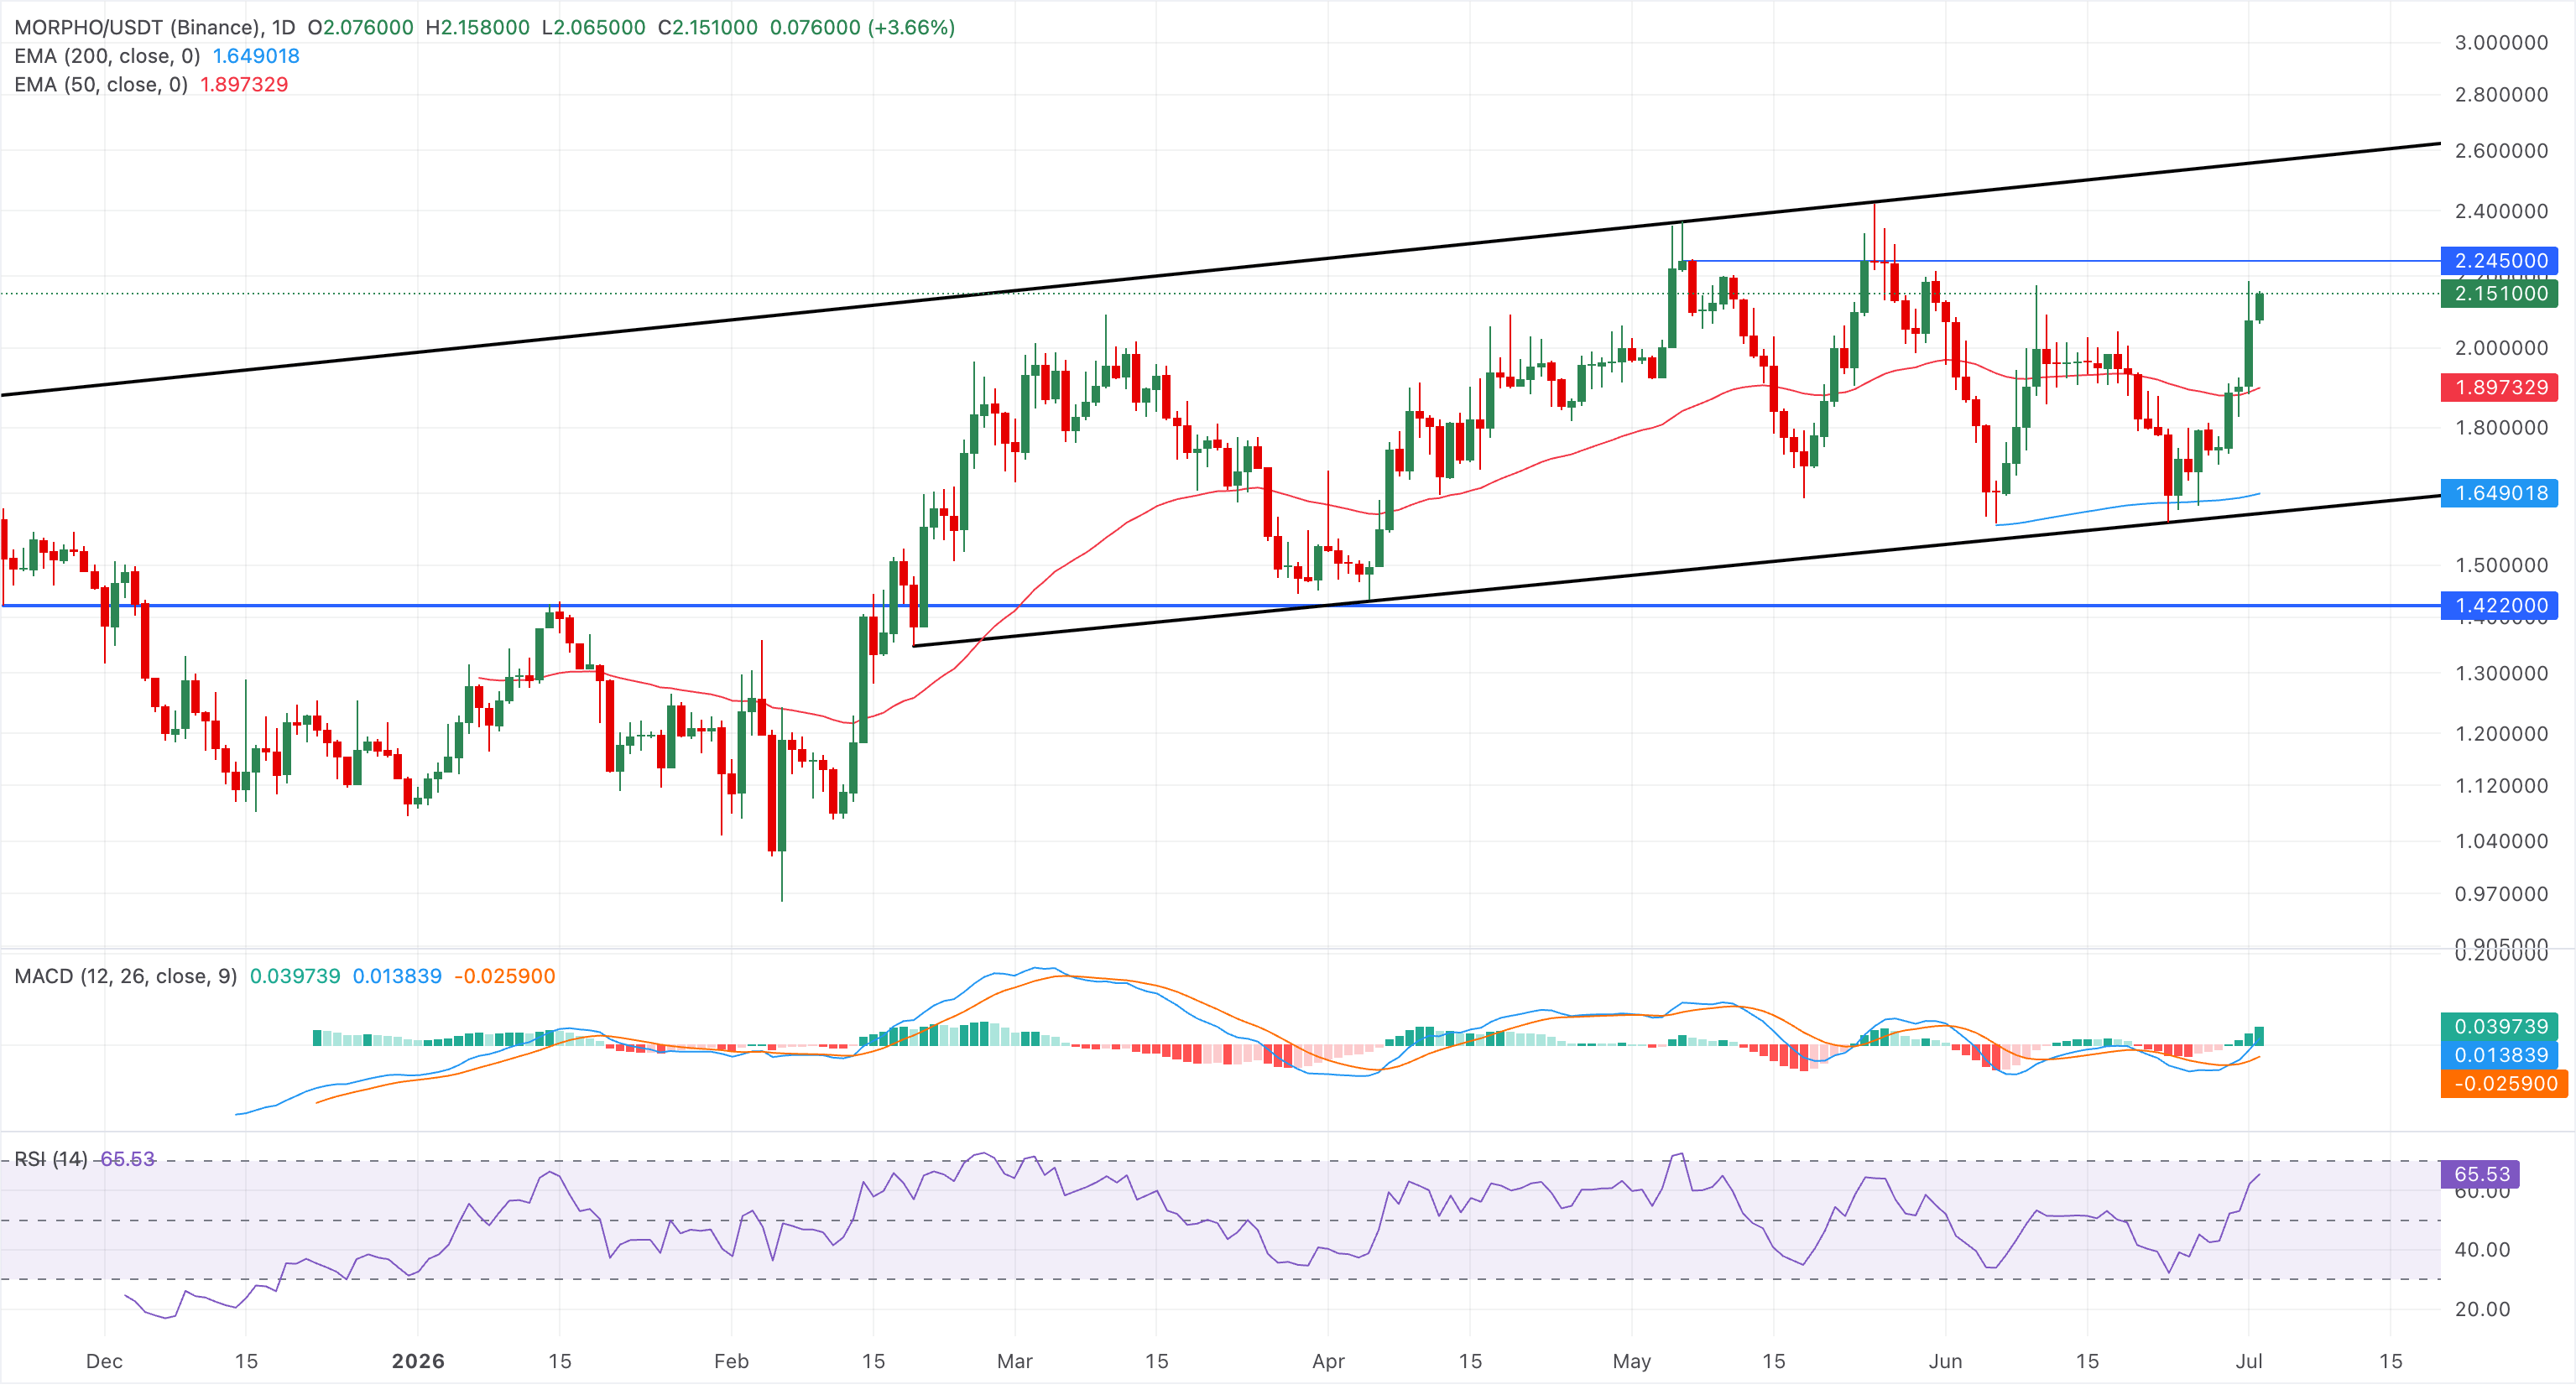
On the downside, immediate support is seen at the 50-day EMA near $1.89, with additional protection from the prior upward support trendline around $1.6046.
(The technical analysis of this story was written with the help of an AI tool.)
Author

Vishal Dixit
FXStreet
Vishal Dixit holds a B.Sc. in Chemistry from Wilson College but found his true calling in the world of crypto.



