Cosmos Hub Price Forecast: ATOM faces downside pressure as bears dominate derivatives markets
- Cosmos Hub trades at $1.74 on Monday, marking a second consecutive week of corrections.
- Metrics show negative sentiment, negative funding rates, rising short bets, and falling user activity.
- The technical outlook suggests a deeper correction toward $1.65.

Cosmos Hub (ATOM) price trades at $1.74 as of Monday, extending its correction for the second consecutive week amid persistent selling pressure. Weakening on-chain and derivatives data support a bearish outlook, while technical analysis remains unfavorable.
Derivatives data shows bearish bias
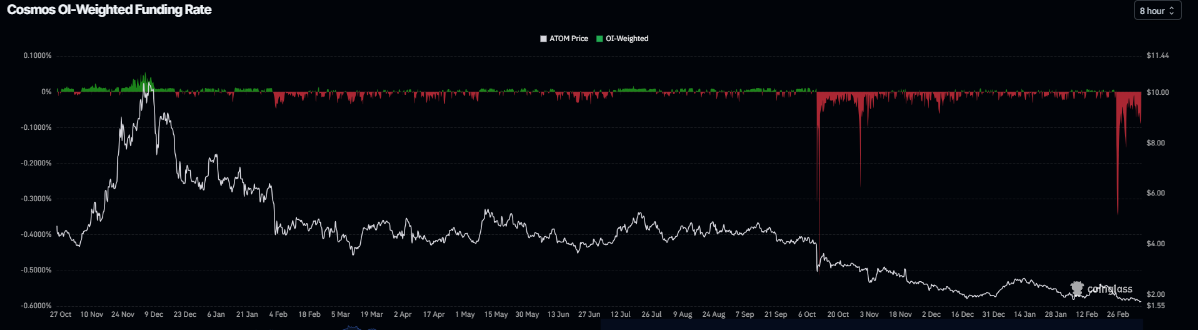
Derivatives data for Cosmos Hub support a bearish outlook. CoinGlass’s OI-Weighted Funding Rate data shows that the number of traders betting that the price of ATOM will slide further is higher than those anticipating a price increase. The metric flipped to a negative rate on February 25 and stands at -0.037% on Monday, indicating shorts are paying longs and suggesting bearish sentiment toward ATOM.
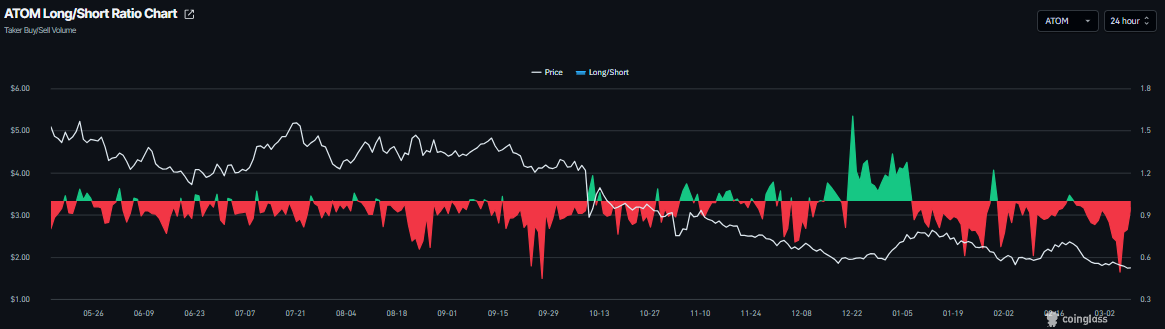
In addition, CoinGlass’s ATOM long-to-short ratio is currently at 0.95 on Monday. This ratio, below one, reflects bearish sentiment in the markets, as more traders are betting on the asset price to fall.
Artemis data shows that daily active users, which tracks network activity over time, also paints a bearish picture for ATOM. The metric has been steadily declining since January and currently stands at 4,200. This fall indicates that demand for Cosmos Hub’s blockchain is decreasing, which doesn’t bode well for ATOM’s price.
-1773035487421-1773035487422.jpeg)
Cosmos Hub Price Forecast: Bears aiming for $1.65 mark
ATOM price trades at $1.74 as of writing on Monday. The near-term bias is mildly bearish as price holds below both the 50-day and 100-day Exponential Moving Averages (EMAs), which continue to trend lower and cap recovery attempts.
ATOM has slipped back under the 23.6% Fibonacci retracement at $1.90, measured from the $1.65 low to the $2.69 high, underscoring a lack of buying follow-through after October’s bounce.
The Relative Strength Index (RSI) on the daily chart sits in the mid-30s, reflecting persistent but not extreme downside pressure, while the Moving Average Convergence Divergence (MACD) indicator remains below the signal line in negative territory with a flat histogram, reinforcing a weak momentum backdrop rather than an impulsive selloff.
Immediate resistance is seen at the $1.83 horizontal line, with the 23.6% retracement at $1.90 as the next upside hurdle, ahead of stronger resistance from the 38.2% retracement at $2.05. A daily close above $1.90 would open the way toward the descending 50-day EMA near $2.05, where sellers would be expected to re-emerge.
On the downside, the recent $1.70–$1.72 area acts as initial support before the Fibonacci base at $1.65, where a break would confirm continuation of the broader downtrend. As long as price holds below $1.83 and the clustered EMAs, rallies remain vulnerable to selling pressure.
(The technical analysis of this story was written with the help of an AI tool.)
Author

Manish Chhetri
FXStreet
Manish Chhetri is a crypto specialist with over four years of experience in the cryptocurrency industry.


