ChainLink Technical Analysis: LINK falls below $12 as bears take full control
- The number of daily active addresses on ChainLink has been steadily decreasing.
- LINK has been failing to get past the $12.78 resistance level.
- One analyst predicts the price to fall to $10 levels.
-637336005550289133.jpg)
ChainLink has been on a massive downtrend since the mid-August $20 rejection. Currently, the price has been failing to get past the $12.78 resistance level. Many believe that LINK/USD’s future price performance is clearly dependent on whether it gets past this level or not. Unfortunately, it looks like we have some bad news for them.
Firstly, the number of daily active addresses on ChainLink has been steadily decreasing. This is always a bearish sign.
 [12.00.12, 14 Sep, 2020]-637357260291621751.png)
Now, let’s look up some technical analysis.
LINK/USD daily chart
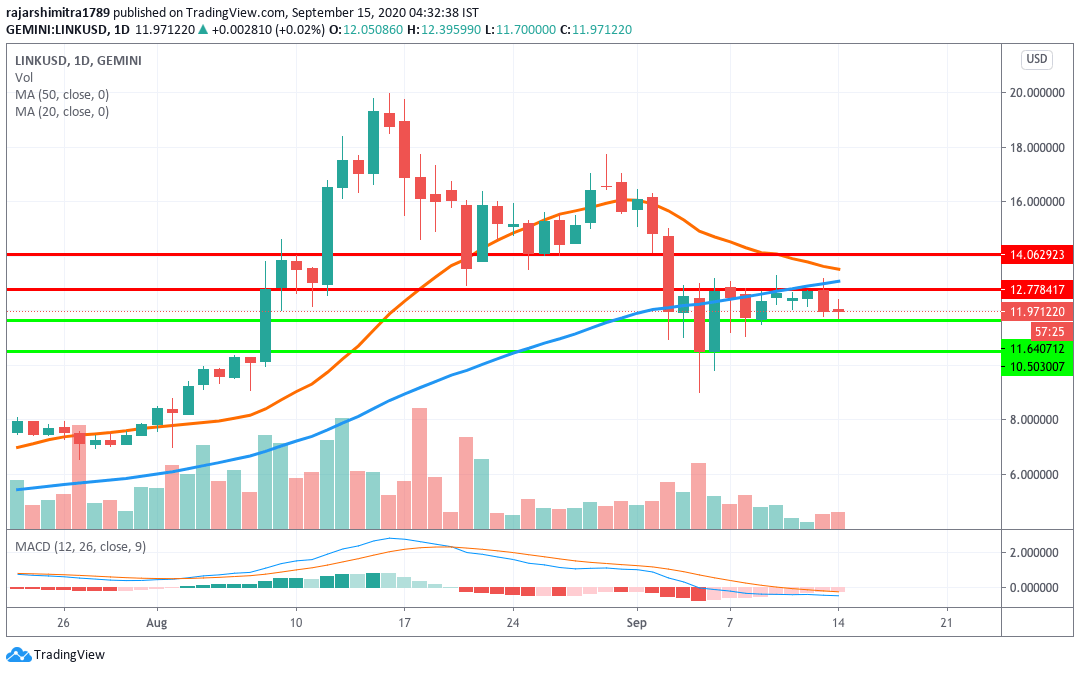
LINK/USD has dropped from $12.77 to $11.97 over the last two days as the MACD shows sustained bearish market momentum. The SMA 50 and SMA 20 are about to cross over each other to form a bearish cross pattern.
So, if a further bearish movement is indeed expected, then how much further can it fall? According to one trader, he is expecting the rejection to spark a massive sell-off over the next few days, which can see LINK fall to $10-levels.
LINK/USD monthly chart
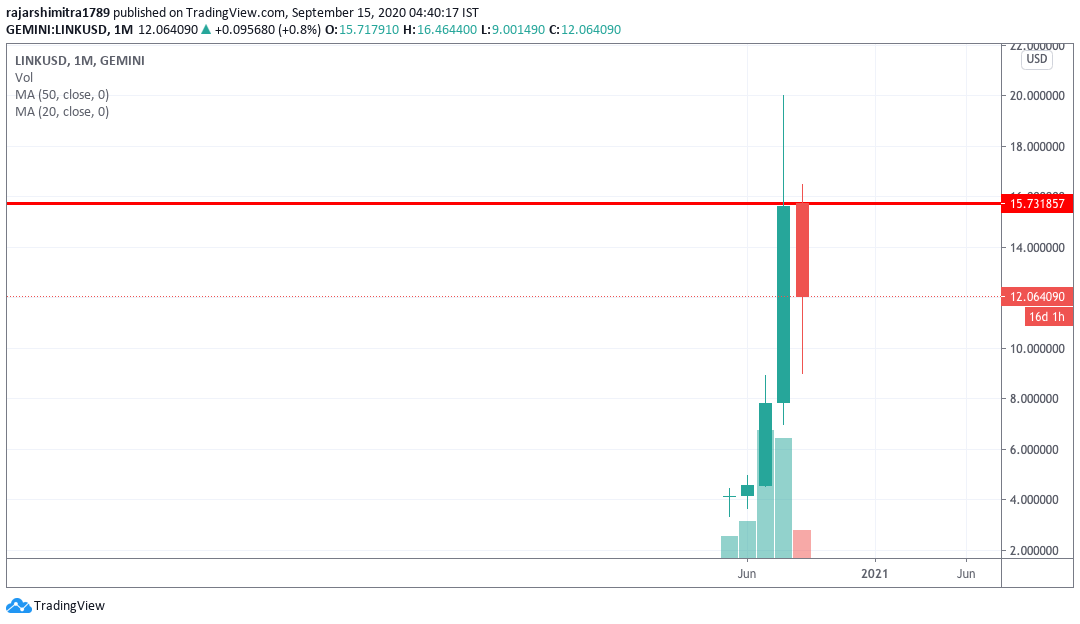
The LINK/USD monthly chart shows how drastic this bearish movement is. The bears are correcting the price following four straight bullish months. The price has dropped from $15.73 to $11.97 over the month.
LINK/USD 4-hour chart
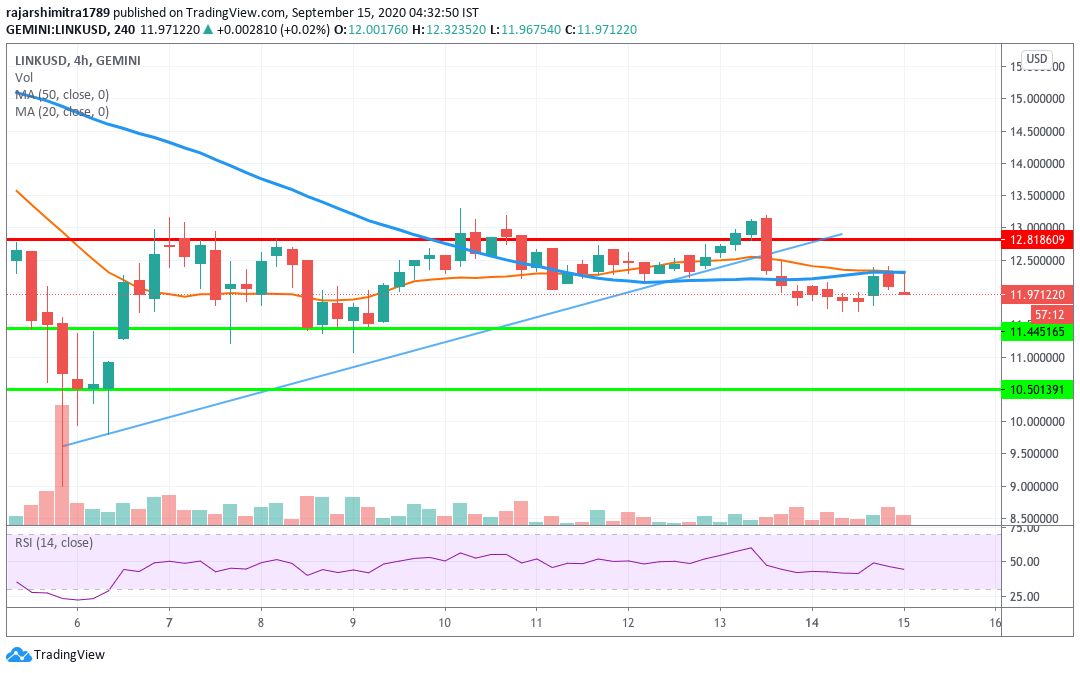
The 4-hour chart shows that the price has faced rejection at both the SMA 50 and SMA 20 curves. The former curve has crossed over the later to chart a bearish cross pattern. The relative strength index (RSI) is trending in the neutral zone, so further bearish correction is expected.
LINK/USD hourly chart

The hourly LINK/USD chart is trying to break above the downward trending line. The buyers bounced up from the $11.96 support line and are looking to break above the trending line and touch the $12.12 resistance level. The MACD shows decreasing bullish momentum.
LINK/USD IOMAP
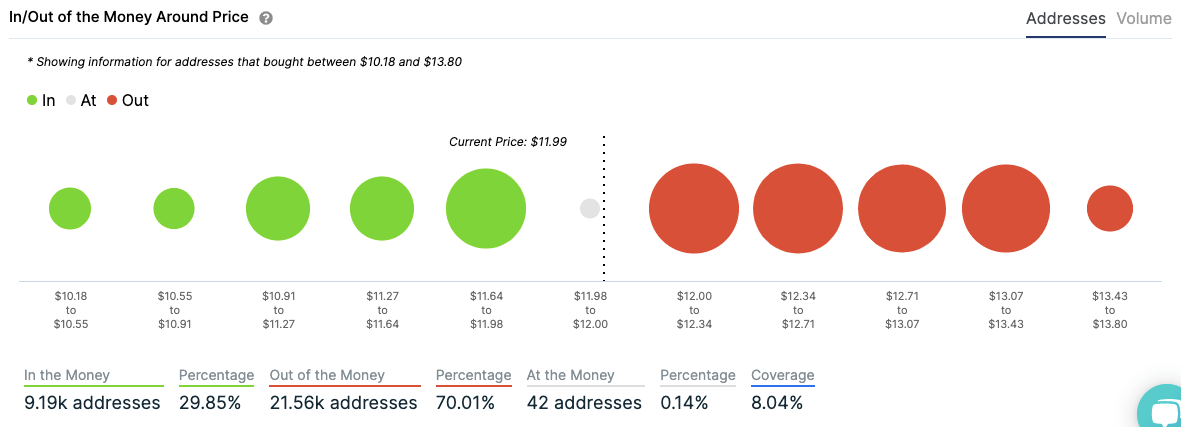
While the analysts are predicting a drop to the $10-level, the IOMAP shows us that the price can drop to $11.64 before it encounters healthy support. On the other hand, the chances of any upward movement look next to none since the price faces a stack of strong resistance levels.
Quotes from Twitter-verse
$LINK / USD
— Cactus (@TheCryptoCactus) September 11, 2020
Honestly not really looking to great right now, currently not looking like the best time to take a long position at resistance but if PA can flip $13.2 I would be long...
Maybe I should just listen to the marines and degen long? pic.twitter.com/sbhvGjwG75
Author

Rajarshi Mitra
Independent Analyst
Rajarshi entered the blockchain space in 2016. He is a blockchain researcher who has worked for Blockgeeks and has done research work for several ICOs. He gets regularly invited to give talks on the blockchain technology and cryptocurrencies.


