Chainlink price sets the stage for 30% bullish breakout
- Chainlink price has formed an Adam and Eve pattern, signaling a 30% rally.
- From the current position, LINK could surge by 40% to hit a target at $20.
- A four-hour candlestick close below March 14 swing low at $12.60 will invalidate the bullish thesis.
-637336005550289133.jpg)
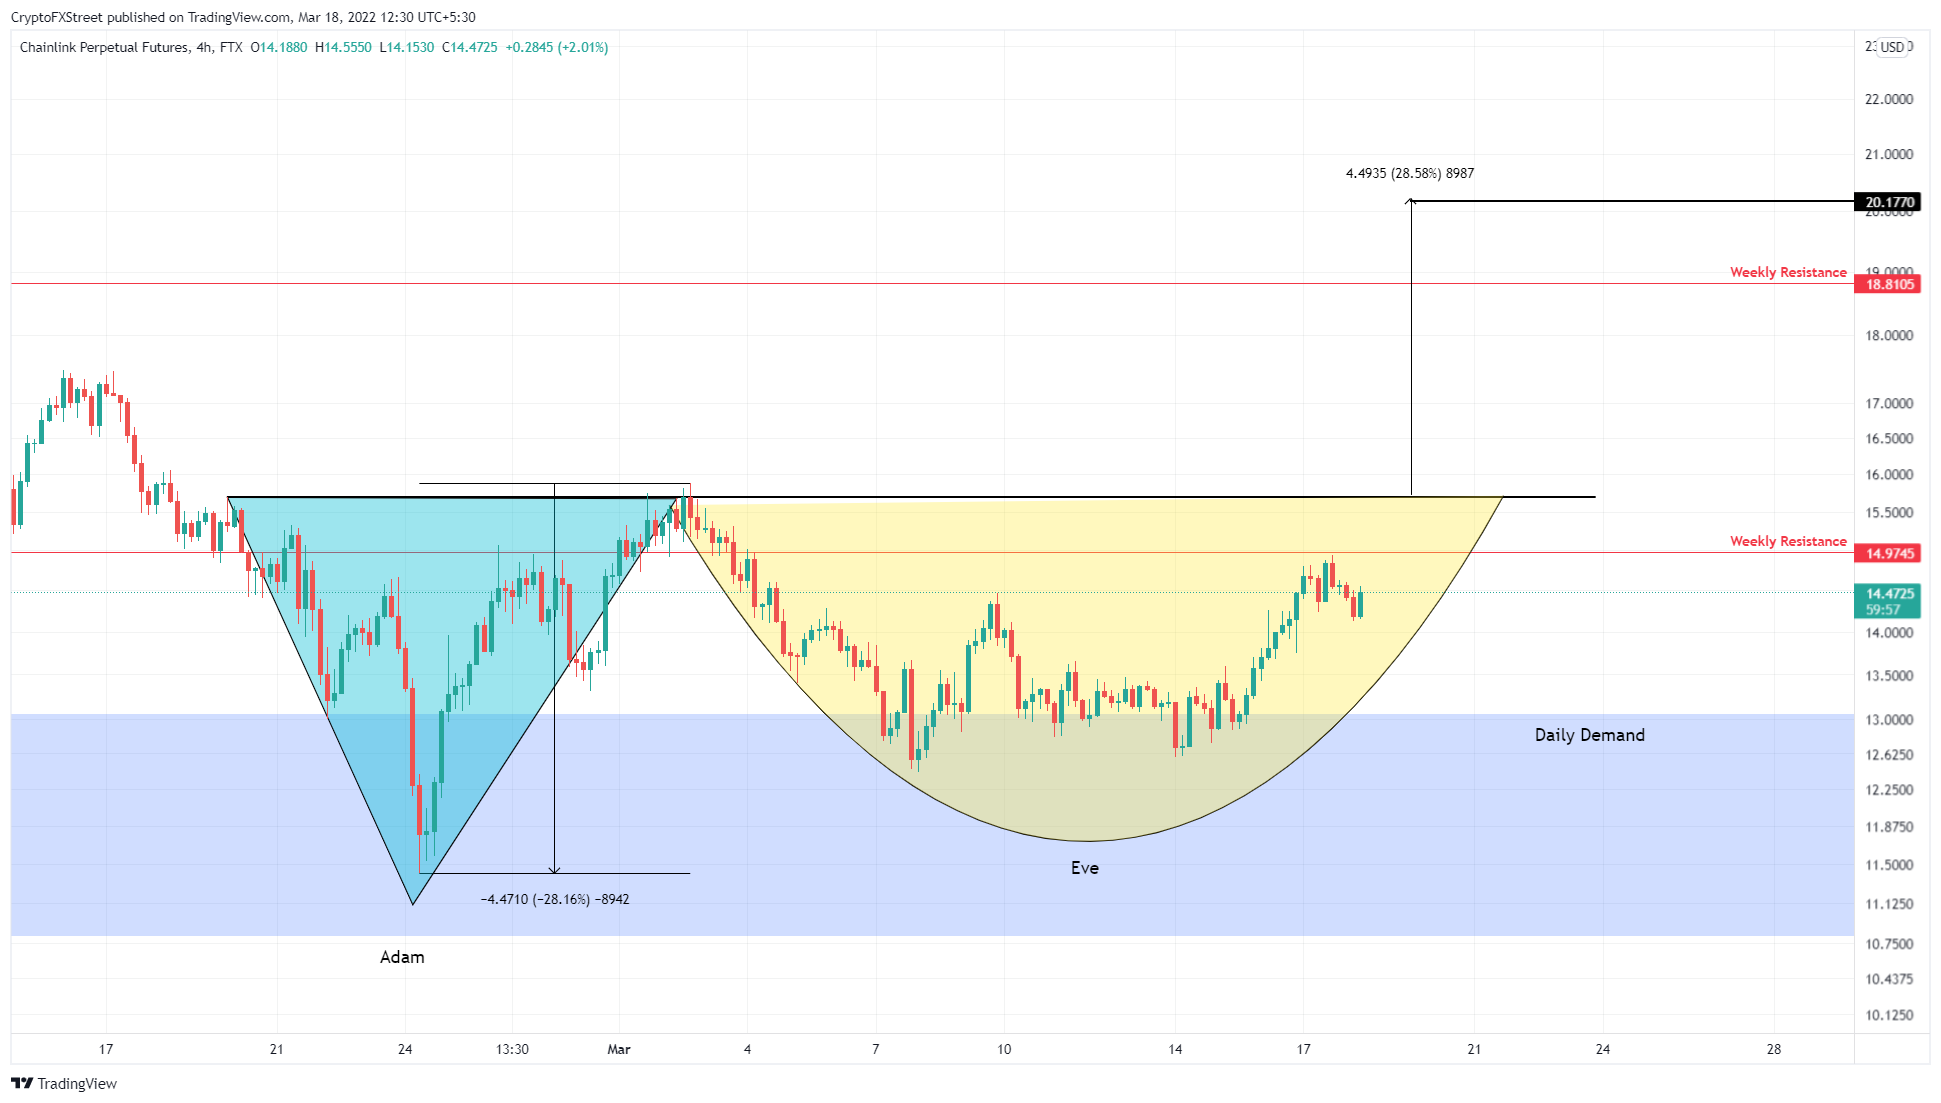
Chainlink price has created a bottom reversal setup that suggests LINK is due for a move up north. While the oracle token is nowhere near a breakout, it indicates the possibility is around the corner.
Chainlink price attempts recovery
Chainlink price set a horizontal trend line at $15.69 on February 18 and dropped roughly 27% to set a swing low at $11.40. The recovery from this downswing was swift but hit a dead end around the $15.69 hurdle.
Since then, the Chainlink price action has strutted around the $13.06 to $10.82 demand zone producing a rounded bottom or sorts. This move is heading back to retest the $15.69 barrier. Assuming this uptrend continues, LINK will form an Adam and Eve pattern, which typically contains two distinct valleys, one V-shaped - known as Adam and the other rounded - referred to as Eve.
This bottom reversal pattern forecasts a 28% upswing to $20.18, obtained by adding the distance between the highest peak and lowest of the two valleys to the breakout point at $15.69. A four-hour candlestick close above this level will signal a breach and trigger a 28% ascent to $20.18.
From the current position, this move would constitute a 40% ascent. Interested investors can open a long position from the current level at $14.48 and book profits around the weekly resistance barrier at $18.81 and the theoretical target at $20.18.
SHIB/USDT 4-hour chart
On the other hand, if the Chainlink price fails to maintain its movement toward $15.69, it will indicate a weakness among buyers.
A four-hour candlestick close below the March 14 swing low at $12.60 will create a lower low, invalidating the bullish thesis for the Chainlink price. In such a case, LINK has the $13.06 to $10.82 demand zone to find support and attempt a comeback.
Author

Akash Girimath
FXStreet
Akash Girimath is a Mechanical Engineer interested in the chaos of the financial markets. Trying to make sense of this convoluted yet fascinating space, he switched his engineering job to become a crypto reporter and analyst.




