Chainlink Price Forecast: On-chain data signals overhead pressure as LINK holds at a crossroads
- Chainlink trades in the red on Monday, giving up the gains from Sunday.
- On-chain data displays strong resistance levels at higher prices, while rising optimism in derivatives boosts Open Interest.
- The technical outlook highlights that Chainlink is at a crossroads amid a short-term surge in supply.

Chainlink (LINK) edges lower by over 2% at press time on Monday, starting the week on a declining trend after posting gains during the weekend. Both the technical outlook and on-chain data show overhead supply pressure that could lead Chainlink to extend the pullback, crushing the Open Interest spike in the derivatives market.
On-chain data forecasts strong headwinds
IntoTheBlock’s Global In/Out of the Money (GIOM) indicator shows LINK within the “at-the-money” zone extending from $13.06 to $14.06. In the same zone, around 50K investors have acquired 105.38 million LINK tokens at an average price of $13.57.
The immediate supply zone between $14.06 and $14.29 holds 19.83 million LINK supply by 13.72K investors. As LINK loses ground in the “at-the-money” overhead supply pressure, it risks a bearish turnaround.
As Chainlink trades at the lower end of the "at-the-money" circle, under pressure from a high supply zone, it signals that the path of least resistance is on the downside.
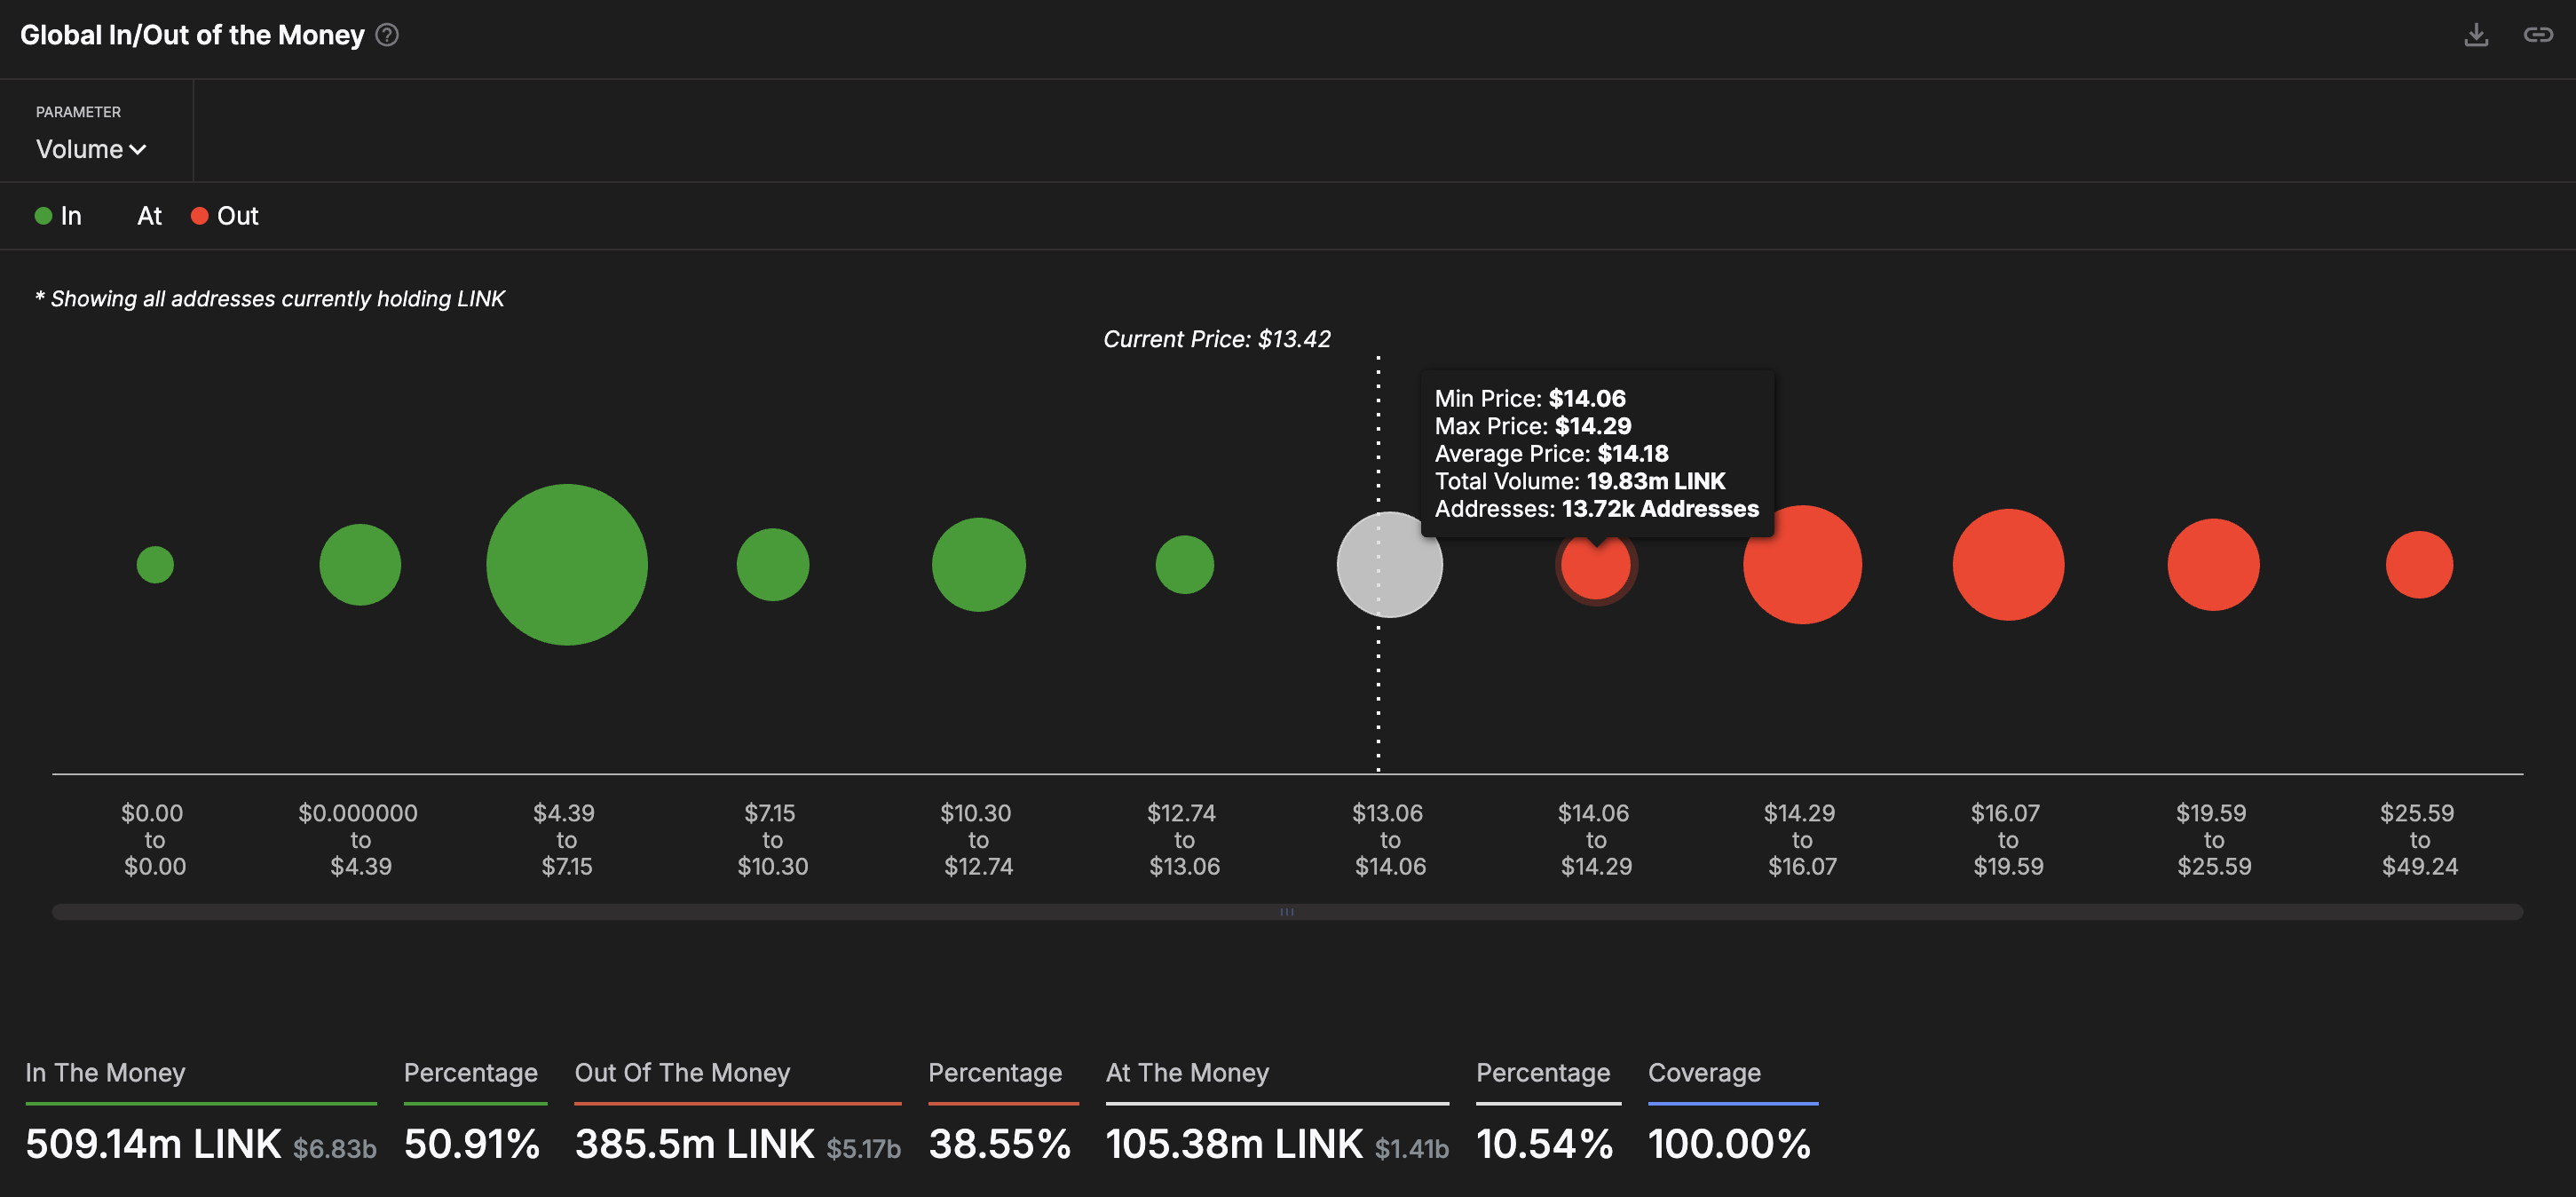
Global In/Out of the Money (GIOM) indicator. Source: Intotheblock
On the other hand, the immediate “in-the-money” zone extends from $12.74 to $13.06 and holds 11.38 million LINK tokens purchased by 13.94K investors, which could absorb the incoming supply.
LINK derivatives put an optimistic lens
Coinglass’ data indicates a 3.84% surge in Open Interest, reaching $559.76 million on Monday. An OI surge indicates increased buying in the derivatives market, signaling heightened optimism.
Adding credence to increased bullish activity, the OI-weighted funding rate spikes to 0.0086% from 0.0004% on Sunday. Positive funding rates are paid by bulls when buying activity boosts swap prices to negate the imbalance and vice versa.
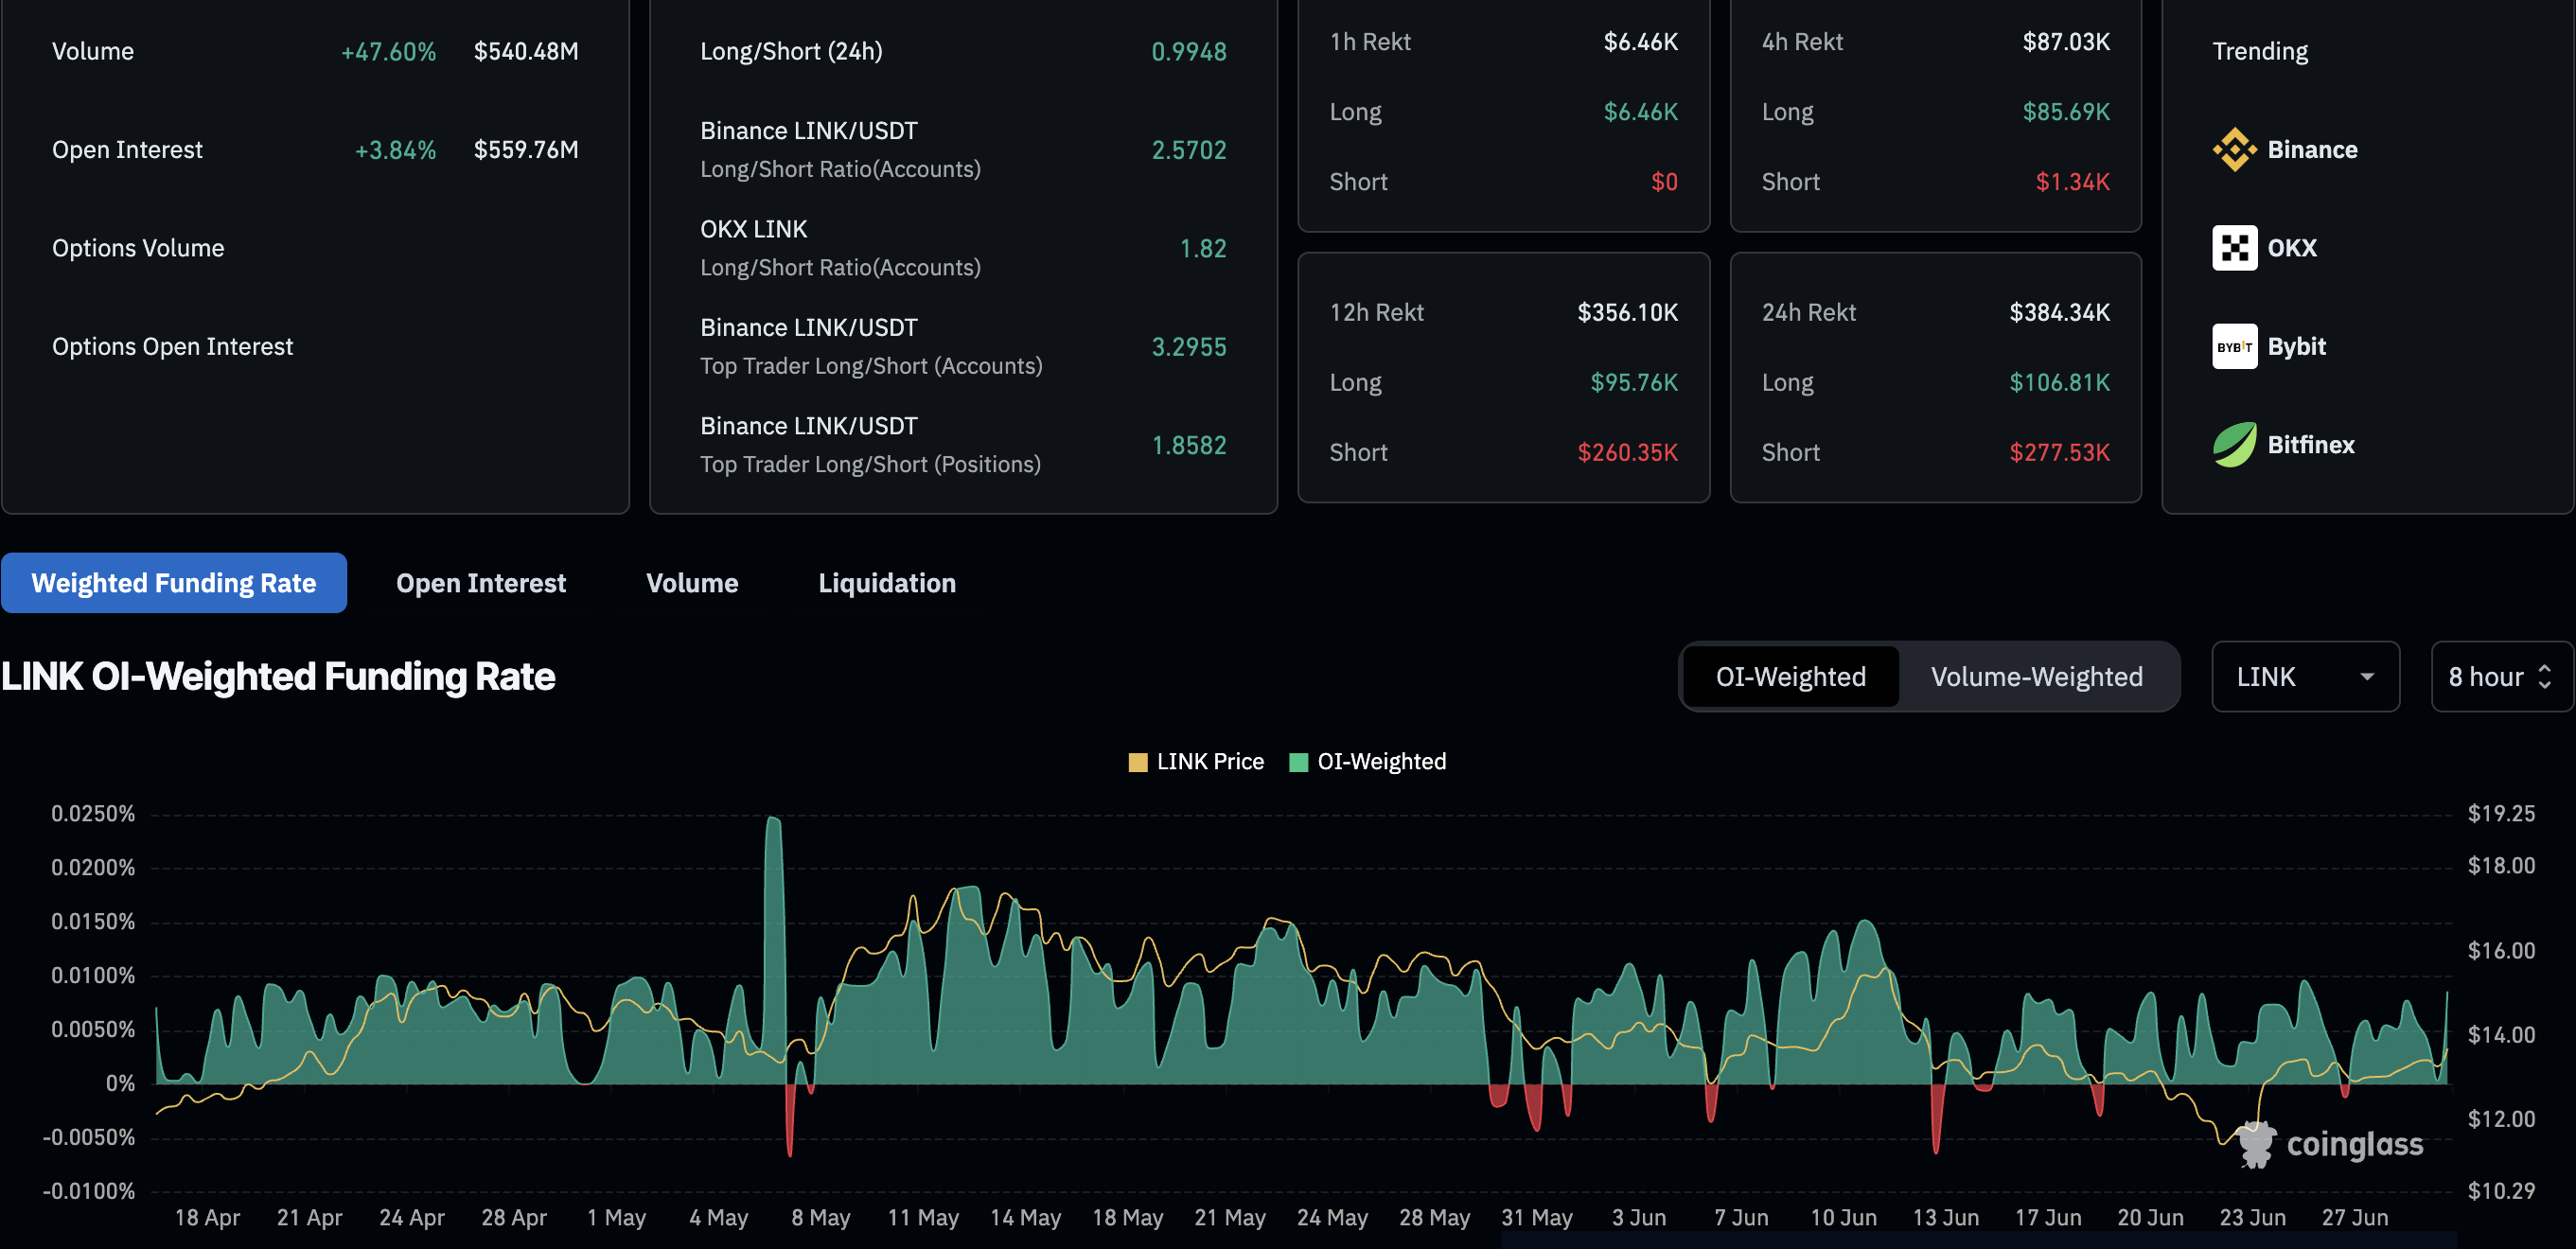
Chainlink derivatives. Source: Coinglass
Chainlink struggles to hold momentum
Chainlink loses ground by over 2% at press time on Monday, nearly undermining the recovery from Sunday. LINK surged by 17% over the last week, but the weak start this week brings it back under the 200-period Exponential Moving Average (EMA) on the 4-hour chart.
The 50-period and 100-period EMAs inch closer to a positive crossover under the influence of the prevailing recovery run. However, the DeFi token must surpass an overhead resistance trendline connected by the swing highs on May 12, May 23, and June 11.
If LINK drops below the 50-period EMA at $13.12, the declining trend could extend towards the $12.63 support level, which was last tested on June 18.
The Relative Strength Index (RSI) is at 52, pointing downwards and reversing from an area close to the overbought zone, suggesting a quick loss of buying pressure.
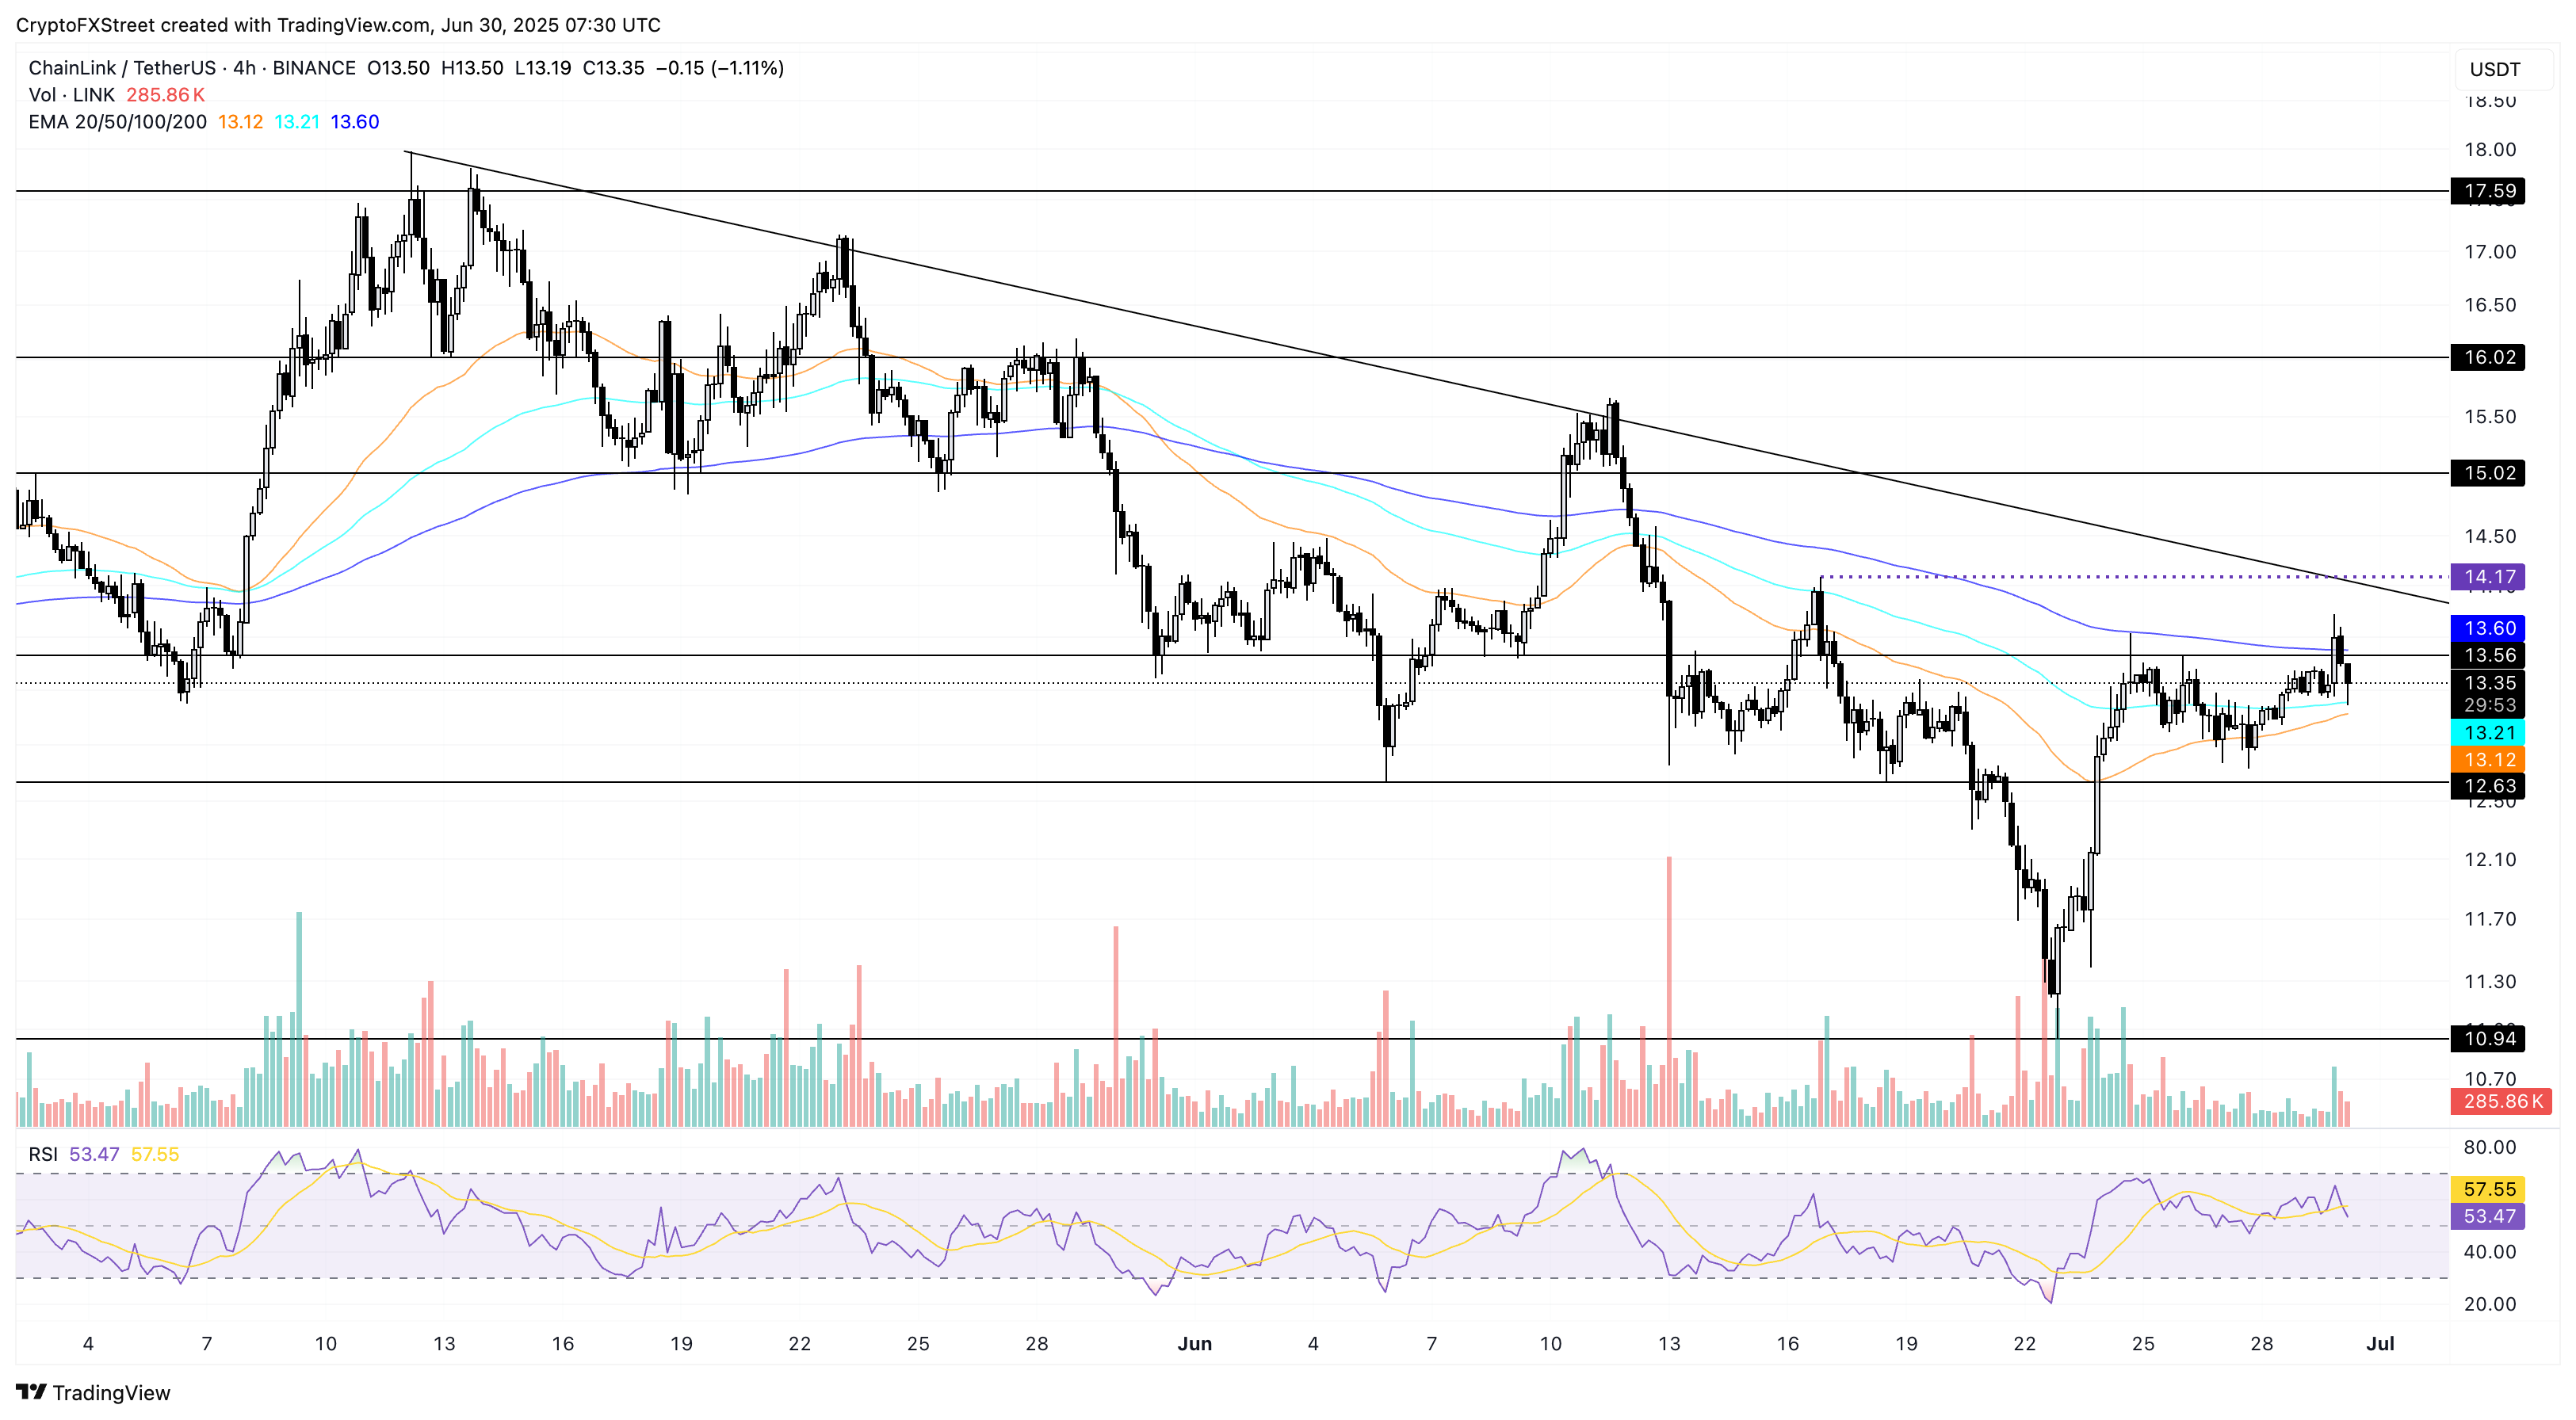
LINK/USDT daily price chart.
On the upside, any recovery hinges on a potential close above the trendline near the monthly high of $14.17. The next level of resistance emerges at $15.02, last tested on June 10.
Author

Vishal Dixit
FXStreet
Vishal Dixit holds a B.Sc. in Chemistry from Wilson College but found his true calling in the world of crypto.


