Celestia Price Forecast: TIA recovery gains traction as retail interest builds
- Celestia is up over 4% so far on Friday, extending its recovery for the third consecutive day.
- Rising social dominance and a double-digit rise in Open Interest reflect renewed retail interest.
- The technical outlook is cautiously bullish as price approaches a key supply zone between $0.4596 and $0.4722.

Celestia (TIA) edges above $0.4400 at press time on Friday, extending recovery for the third consecutive day so far this week. A surge in retail demand and social buzz backs the sudden rebound in price, which lacks a clear fundamental driver. The technical outlook for TIA is bullish, with momentum improving as price nears a key resistance zone between $0.4596 and $0.4722.
Retail frenzy drives Celestia rally
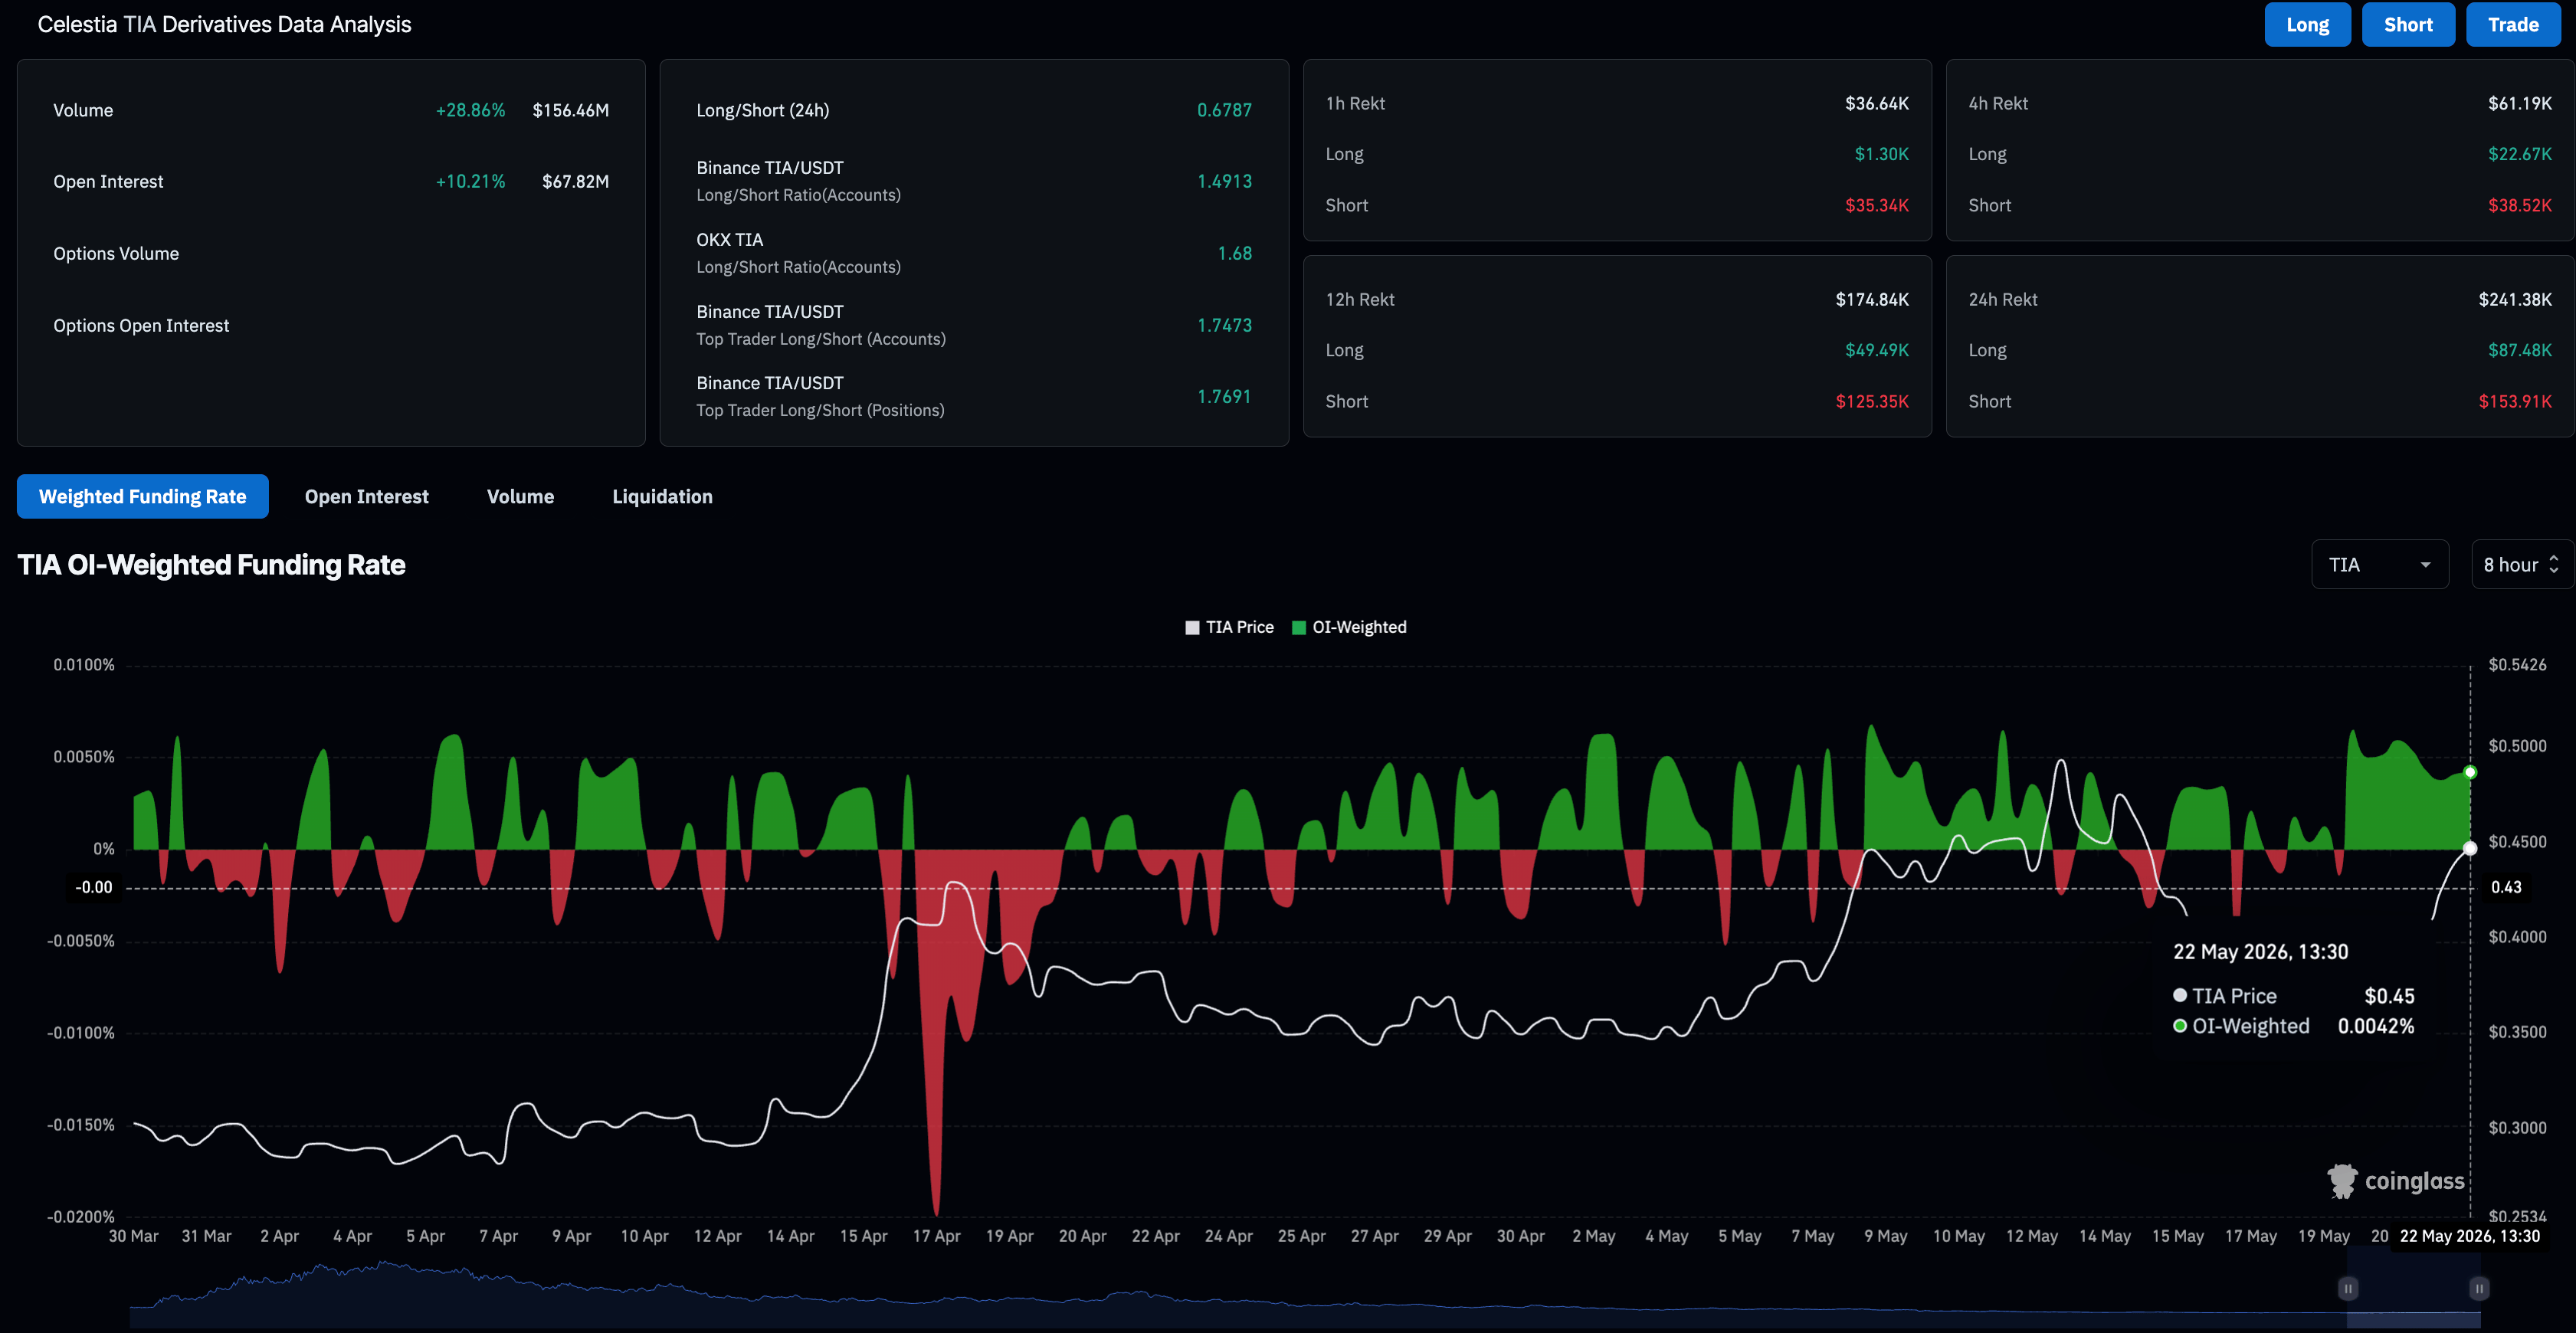
Celestia is gaining retail strength as it emerges as a top performer in the broader crypto market, with three straight days of recovery. CoinGlass data shows an increase in leverage-linked trading activity, driving the TIA Open Interest (OI) to $67.82 million, up over 10% in the last 24 hours. At the same time, the funding rate is 0.0042% as of Friday, suggesting traders are willing to hold long positions at a premium.
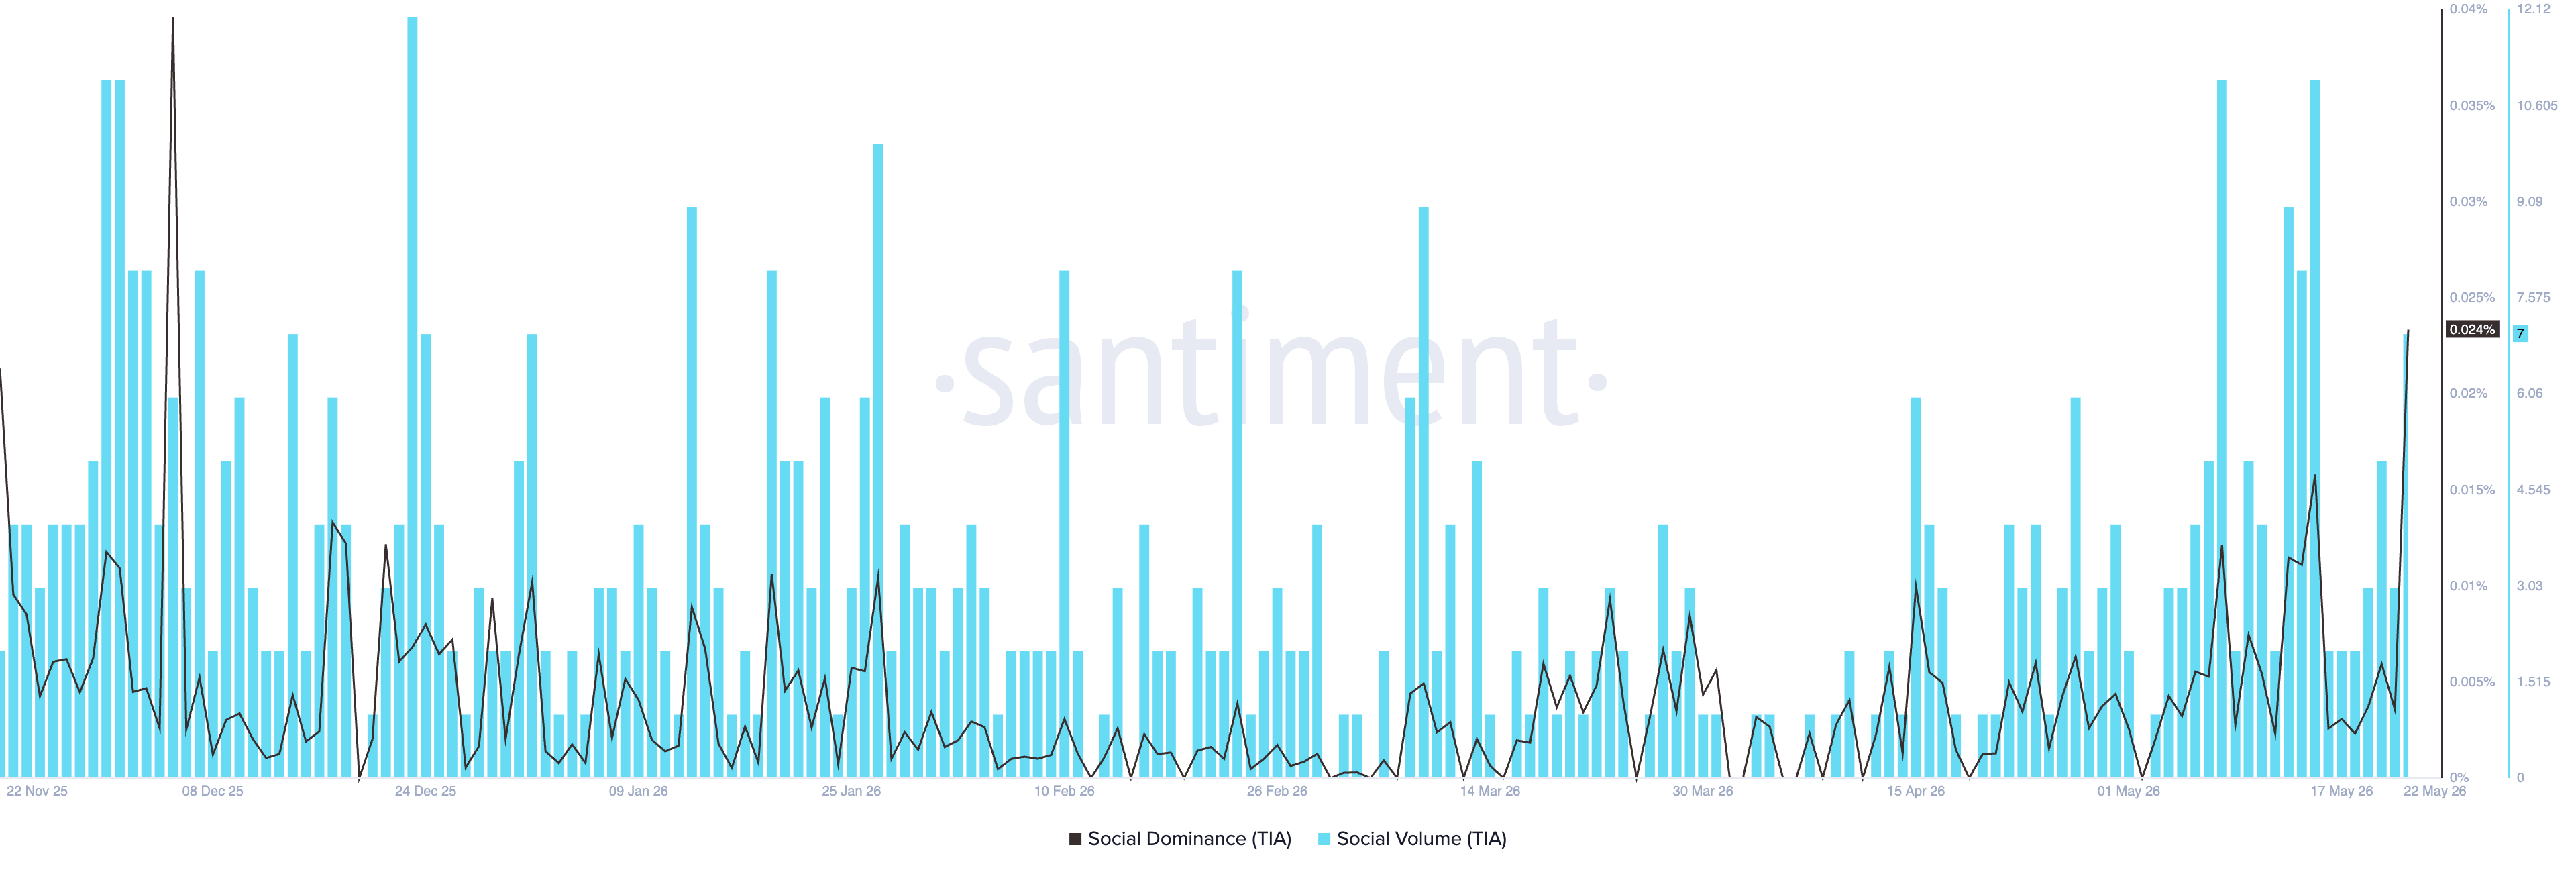
On the other hand, Santiment data shows a sharp uptick in social dominance to 0.024% out of all crypto-related posts, indicating increased social buzz around Celestia.
Technical outlook: Will Celestia rally cross $0.50?
Celestia holds a constructive near‑term bias, with three straight days of recovery, beginning with a 6% rebound on Wednesday. The short-term rally has crossed above the 100-day EMA at $0.4015 and the 50% retracement level at $0.4104, measured from the January 13 high of $0.6257 to the February 6 low of $0.2693.
The immediate resistance for TIA lies at the $0.4596-$0.4722 supply zone, which capped an earlier breakout attempt this month. A clear push above this zone would position 78.6% Fibonacci retracement level at $0.5224 as the next resistance.
The Relative Strength Index (RSI) near 60 on the daily chart suggests persistent buying pressure, with further upside potential before reaching the overbought zone. Meanwhile, the Moving Average Convergence Divergence (MACD) rises toward its signal line, hinting at a potential bullish crossover. The contracting negative histogram bars reaffirm a declining downside momentum.
On the downside, first support is located at the 50% retracement level at $0.4104, reinforced by the 100‑day EMA at $0.4015 and the 50‑day EMA at $0.3844.
(The technical analysis of this story was written with the help of an AI tool.)
(This story was corrected at 11:10 GMT to say in the first bullet and paragraph that it is Friday, and not Thursday.)
Author

Vishal Dixit
FXStreet
Vishal Dixit holds a B.Sc. in Chemistry from Wilson College but found his true calling in the world of crypto.



