Cardano Price Forecast: ADA at crossroads as rejection meets fading momentum
- Cardano trades red on Friday after failing to close above key resistance earlier this week.
- Mixed sentiments in derivatives market caps ADA recovery.
- The technical outlook suggests a mild bearish near-term bias, with momentum indicators signaling a fading bullish trend.

Cardano (ADA) price slips below $0.26 on Friday after being rejected from the key resistance zone earlier this week. Mixed signals from the derivatives market, coupled with weakening momentum indicators, suggest fading bullish momentum, leaving ADA exposed to a potential short-term pullback.
Mixed sentiment among derivatives traders caps ADA recovery
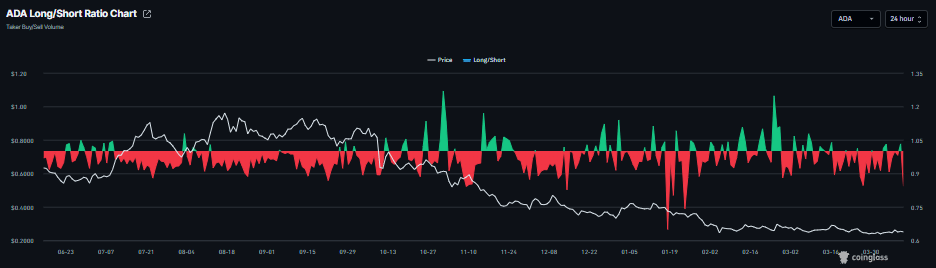
Cardano’s derivatives data also shows mixed signals. CoinGlass' long-to-short ratio for ADA reads 0.84 on Friday. This ratio, being below one, reflects bearish sentiment in the market, as more traders are betting on the asset’s price to fall.
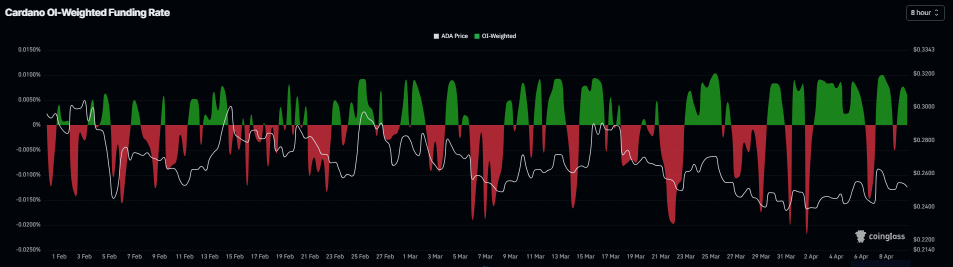
Meanwhile, the funding rates support a bullish thesis. CoinGlass’ OI-Weighted Funding Rate data shows that the number of traders betting that the price of Cardano will slide further is lower than those anticipating a price increase. The metric flipped to a positive rate on Thursday and currently stands at 0.0066% on Friday, indicating that longs are paying shorts.
This combination suggests indecision among Cardano investors and limits the chances of a sustained recovery.
Cardano Price Forecast: Momentum indicators shows fading bullish strength
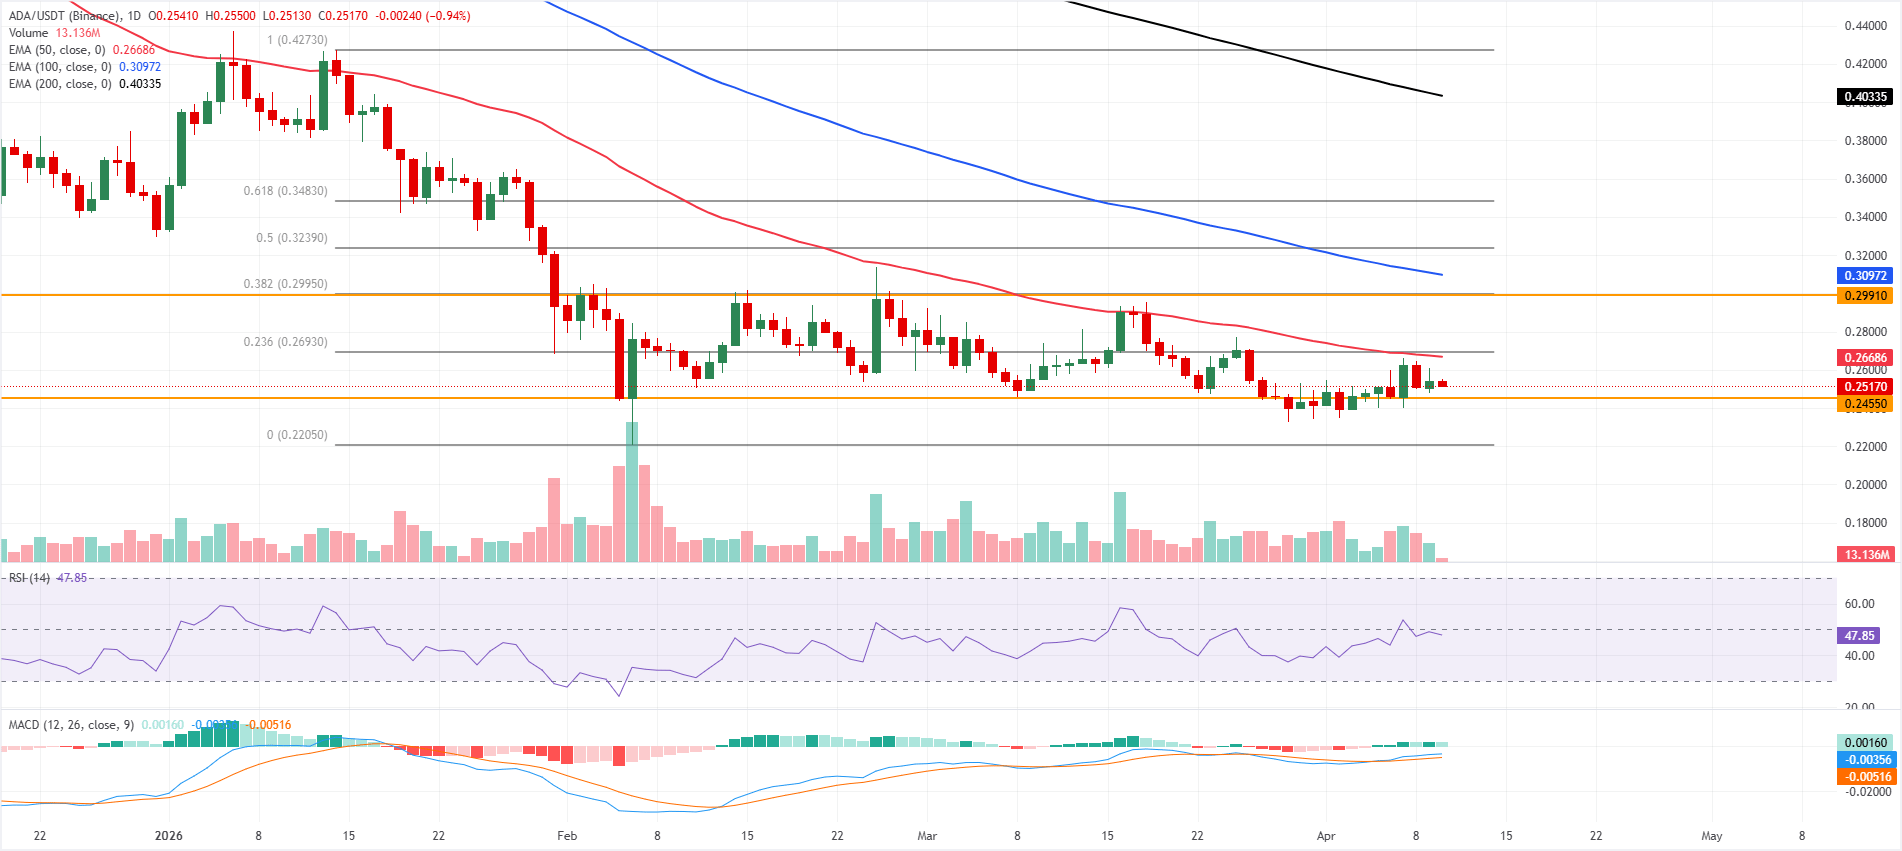
Cardano price is trading at $0.25, maintaining a bearish near-term bias as it holds well below the 50-day, 100-day, and 200-day Exponential Moving Averages (EMAs), which are clustered between roughly $0.27 and $0.40.
The Relative Strength Index (RSI) on the daily chart hovers just under the neutral 50 mark, hinting at subdued downside momentum rather than a capitulation sell-off, while the Moving Average Convergence Divergence (MACD) line remains slightly positive, suggesting that any bounces are corrective as long as price stays capped beneath the nearby EMA and Fibonacci layers overhead.
On the topside, initial resistance is located at the 50-day EMA near $0.26, followed closely by the 23.6% Fibonacci retracement at $0.26, forming a first supply zone. Above that, the horizontal barrier at $0.29 and the 38.2% retracement at $0.29 create a tighter resistance cluster ahead of the 100-day EMA at $0.30, with higher Fibonacci levels at $0.32 and $0.34 extending the bearish structure toward the 200-day EMA at $0.40 and the swing high region around $0.42.
On the downside, immediate support emerges at the horizontal level of $0.24; a clear break there would expose the Fibonacci anchor around $0.22, where buyers may attempt to build a more durable base.
(The technical analysis of this story was written with the help of an AI tool.)
Author

Manish Chhetri
FXStreet
Manish Chhetri is a crypto specialist with over four years of experience in the cryptocurrency industry.




