Solana Price Forecast: ETF outflows and bearish derivatives data reinforce downside risks
- Solana price trades in red on Thursday after being rejected from key resistance the previous day.
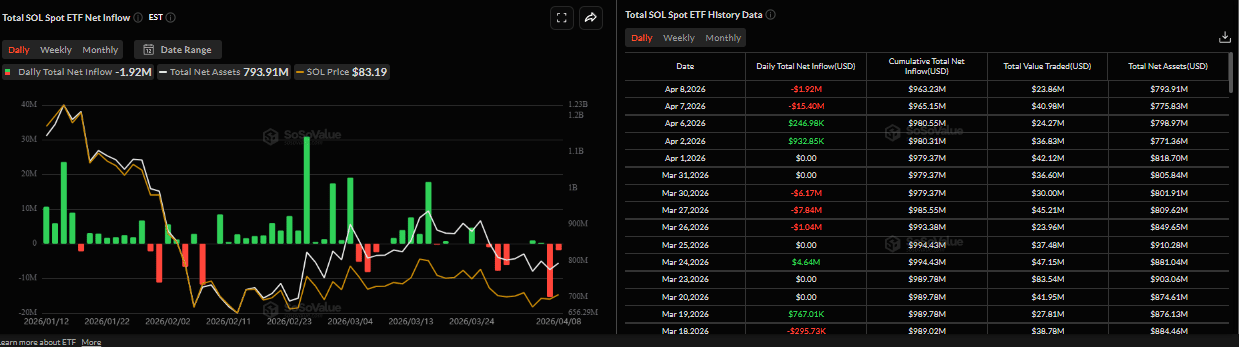
- The US-listed spot ETFs recorded an outflow of $1.92 million, after the highest single-day outflow in the previous day.
- Derivatives metrics support a bearish outlook with funding rates turning negative alongside rising short bets.

Solana (SOL) extends the correction, trading below $82 at the time of writing on Thursday after being rejected from key resistance the previous day. Institutional demand continues to weaken, as SOL spot Exchange Traded Funds (ETFs) recorded an outflow on Wednesday, following the largest single-day withdrawal since their launch. Weakening derivatives data alongside a bearish technical outlook suggest further losses ahead.
Institutional demand shows signs of weakness
Institutional demand for SOL continues to weaken so far this week. SoSoValue data shows that spot SOL ETFs recorded an outflow of $1.92 million on Wednesday, following a $15.40 million withdrawal the previous day, the largest single-day withdrawal since their launch. If these outflows continue and intensify, SOL could extend its correction further.
Solana’s derivatives data signals bearish bias
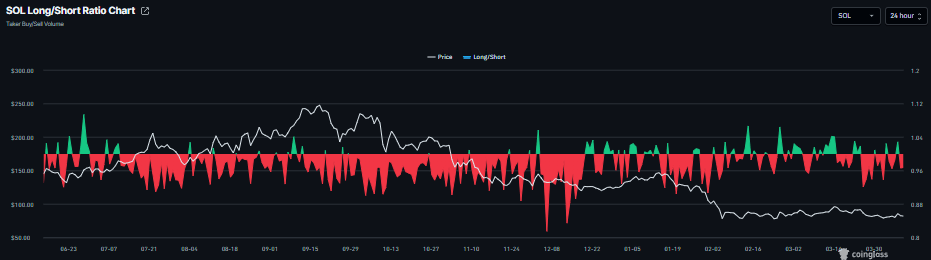
On the derivatives side, SOL shows a negative outlook. CoinGlass data shows Solana’s long-to-short ratio reads 0.96 on Thursday. This ratio, being below one, reflects bearish sentiment in the markets, as more traders are betting on the asset price to fall.
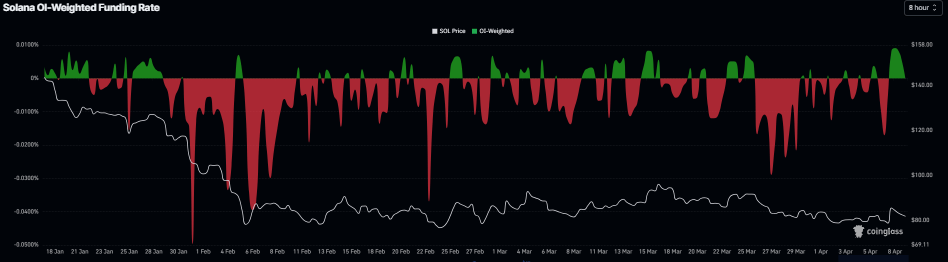
In addition, SOL funding rates data have flipped to negative on Thursday, reading -0.0003%, indicating that shorts are paying the longs and projecting a bearish outlook.
Solana Price Forecast: SOL faces rejection from the key resistance zone
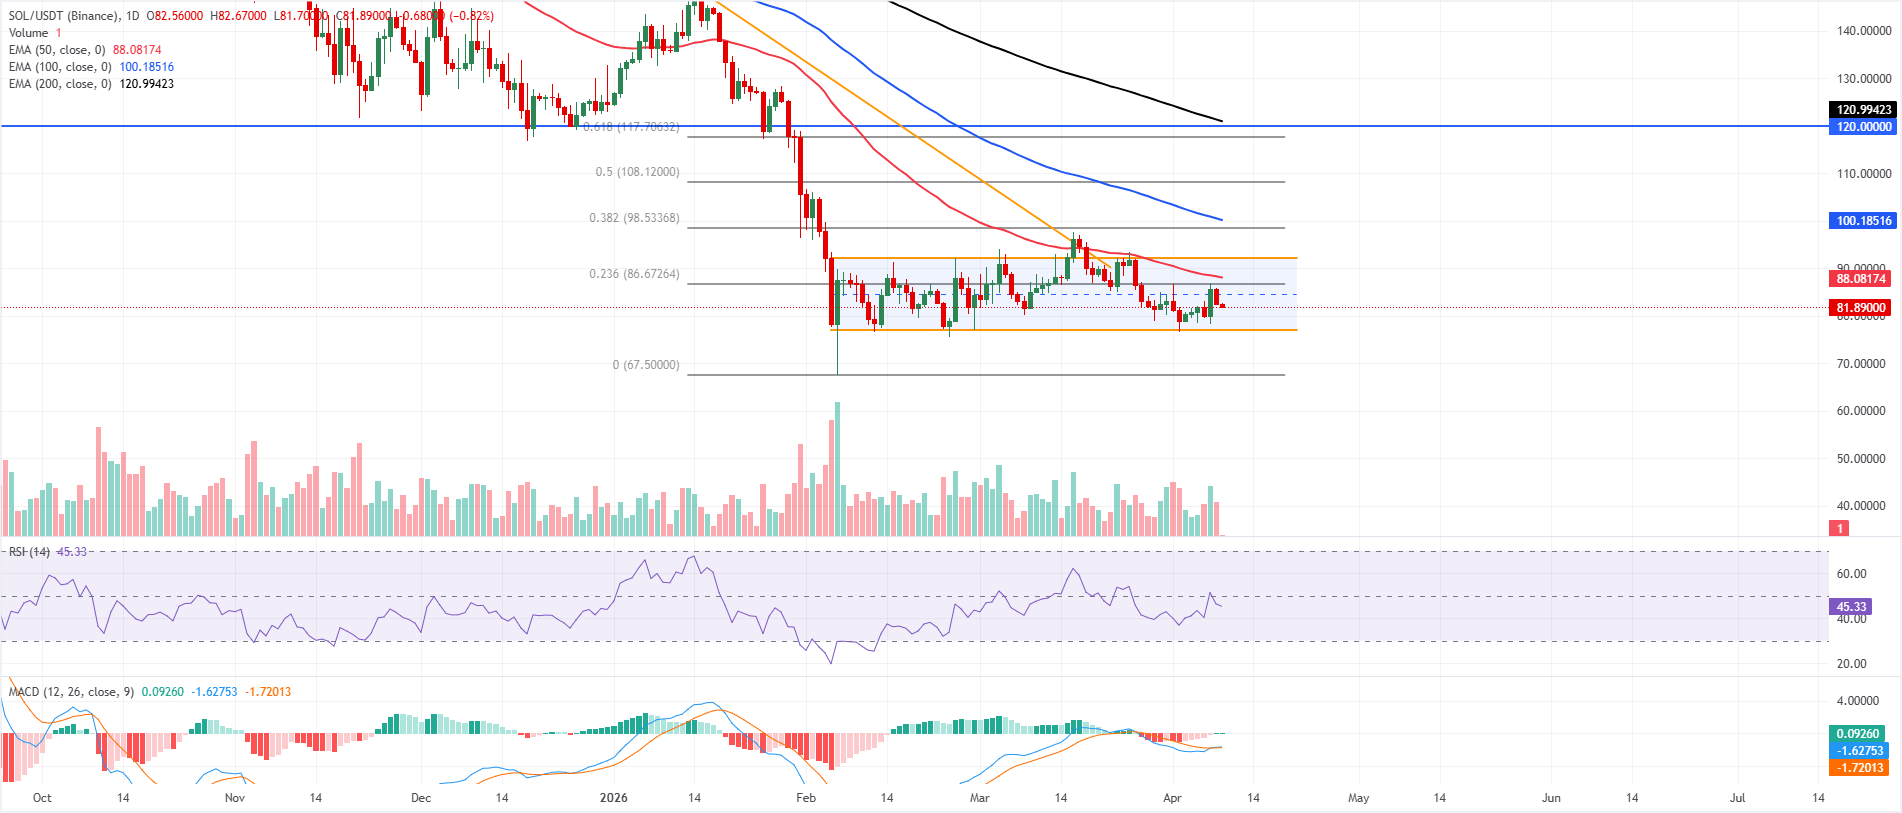
Solana price trades at $81.88 on Thursday, keeping a bearish near-term bias as price holds beneath the 50-day Exponential Moving Average (EMA) at $88.08 and the 100-day EMA near $100.19, while the 200-day EMA is around $120.99 and the horizontal barrier at $120.00 reinforce the broader topside cap.
Momentum remains soft, with the Relative Strength Index (RSI) on the daily chart hovering in the mid-40s after rejection from the neutral level of 50, indicating bearish momentum gaining traction. The Moving Average Convergence Divergence (MACD) is only modestly positive and remains below zero for much of the recent period, suggesting that rebounds are likely to face selling pressure at overhead levels rather than signaling a sustained trend reversal.
On the topside, initial resistance is aligned with the 23.6% Fibonacci retracement at $86.67, followed closely by the 50-day EMA at $88.08, while the upper boundary of the parallel channel around $92.11 forms the next hurdle before higher Fibonacci and EMA barriers cluster between roughly $98.53 and $120.99.
On the downside, immediate protection is provided by the lower edge of the same channel near $77.12; a close below suggests a deeper correction toward the Fibonacci anchor at $67.50.
(The technical analysis of this story was written with the help of an AI tool.)
Author

Manish Chhetri
FXStreet
Manish Chhetri is a crypto specialist with over four years of experience in the cryptocurrency industry.



