BTC/USD technical analysis: The market has shown some signs of a breakout
- Bitcoin is slightly lower trading 1.91% down for the day.
- There are some technical signs of a break higher but we need more confirmation.

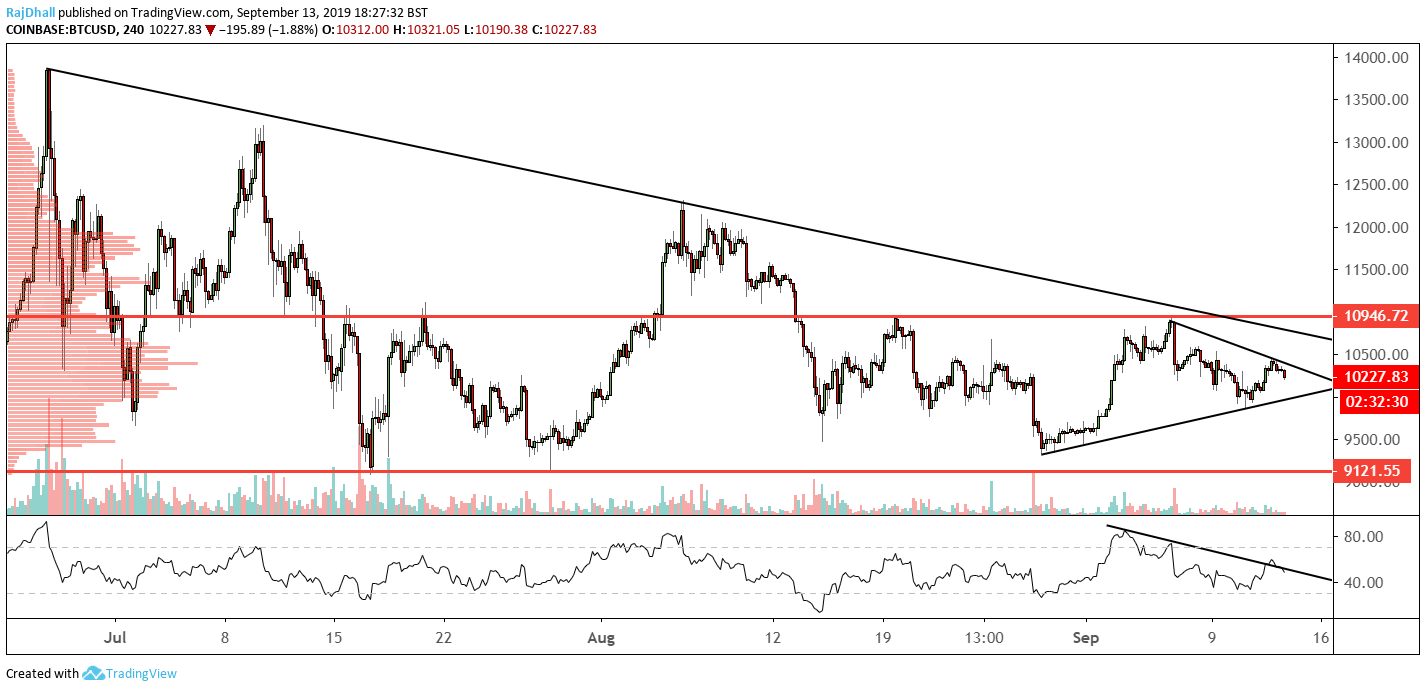
As the price moved lower earlier in the month, the low didn't quite test the low of the consolidation period at 9,212.55.
The RSI (Relative Strength Index) trendline showed a break to the upside but a depressed price has subsequently brought it back under the line.
The only thing that will confirm the break higher would be a push above the 10,964.72 resistance and price is some way off at the moment.
The bulls can take solace in the fact that price has rejected 10K to the downside on a number of occasions.
On the higher timeframes, the overall trend is still lower as you can see the peaks of the price wave slanting downward.
The base of the formation is still holding strong at 9,121.55 so sideways is still the forecast for now.
As an analyst, I am hoping we break the sideways channel soon and push to higher levels. It feels like the markets are awaiting the ETF decision or the start of the Bakkt futures contract to see the take-up.
Author

Rajan Dhall, MSTA
FX Daily
Rajan Dhall is an experienced market analyst, who has been trading professionally since 2007 managing various funds producing exceptional returns.


