BNB Price Forecast: BNB recovery receives boost as trading volume hits $11.35 billion, highest yearly level
- BNB price extends its recovery, trading around $670 on Tuesday after rebounding from a key level.
- On-chain data paints a bullish picture as BNB’s ecosystem trading volume and stablecoin activity are increasing.
- The technical outlook indicates a bullish breakout, targeting a higher leg.

BNB (BNB) is extending its recovery, trading around $670 on Tuesday after rebounding from a key level over the weekend. On-chain data and technical outlook suggest a rally ahead as BNB breaks above the symmetrical triangle pattern, with ecosystem trading volume and stablecoin activity surging.
BNB trading volume and stablecoin reach record levels
Token terminal data indicate that the BNB ecosystem’s trading volume (the aggregate trading volume generated by all exchange applications on the chain) reached a new yearly high of $11.35 billion on Sunday and has been steadily rising since early May. This volume rise indicates a surge in traders’ interest and liquidity in the BNB chain, boosting its bullish outlook.
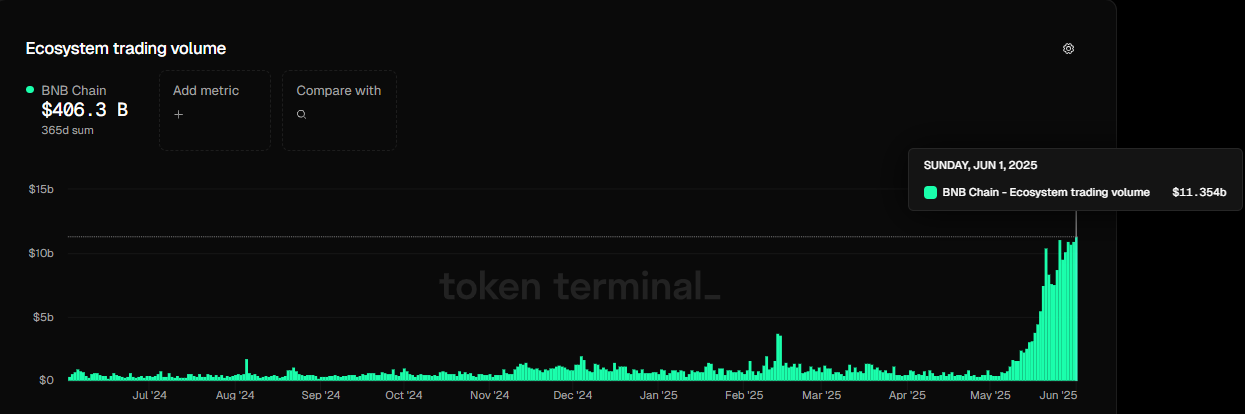
BNB Ecosystem trading volume chart. Source: Token terminal
BNB’s stablecoin supply has been actively rising and reached $10.2 billion, the highest year-to-date (YTD) level last week, according to Atermis terminal data. Such stablecoin activity and value increase on the BNB project indicate a bullish outlook, as it boosts network usage and can attract more users to the ecosystem, driven by Decentralized Finance (DeFi), meme coins, and payment use cases.
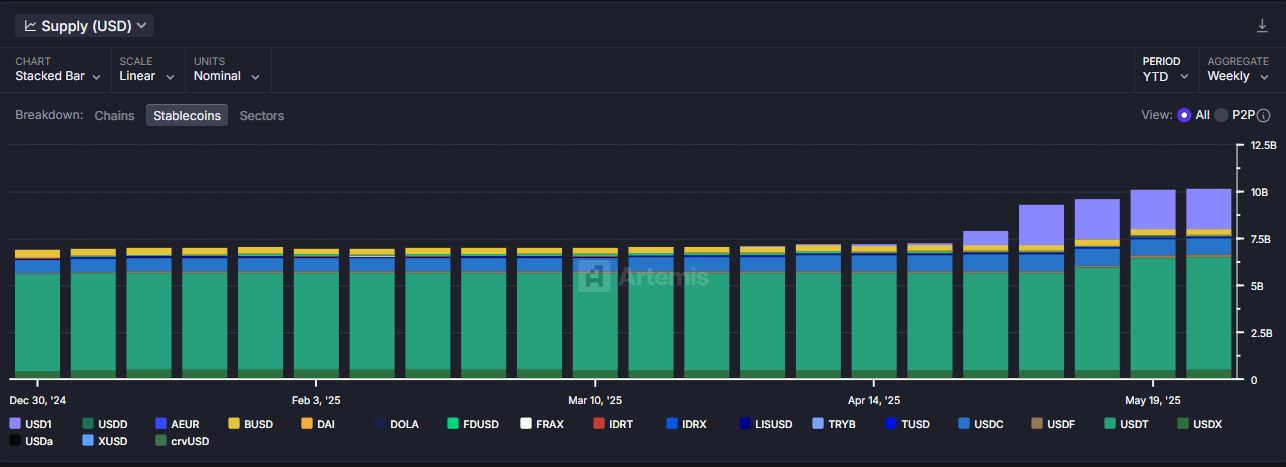
BNB stablecoin supply chart. Source: Atermis terminal
BNB Price Forecast: BNB bulls target levels above $700
BNB’s price broke above a symmetrical triangle on May 8, a technical pattern formed by connecting multiple highs and lows with two converging trendlines (from January to early May) and rallied more than 10%. However, it has been consolidating between the $638 and $696 ranges for more than 21 days. At the time of writing on Tuesday, it trades inside this range at around $668.
If BNB closes above the upper range of consolidation at $696, it could extend the rally to reach the technical target of the symmetrical triangle at $839.14 (obtained by measuring the distance between the first daily high and the first daily low and adding it to the breakout point). This is a theoretical target, and traders could realize some profits around the weekly level of $709.29 and at the Feburary 13 high of $732.
The Relative Strength Index (RSI) on the daily chart reads 55 and points upward after rebounding from its neutral level of 50, indicating bullish momentum is gaining traction.
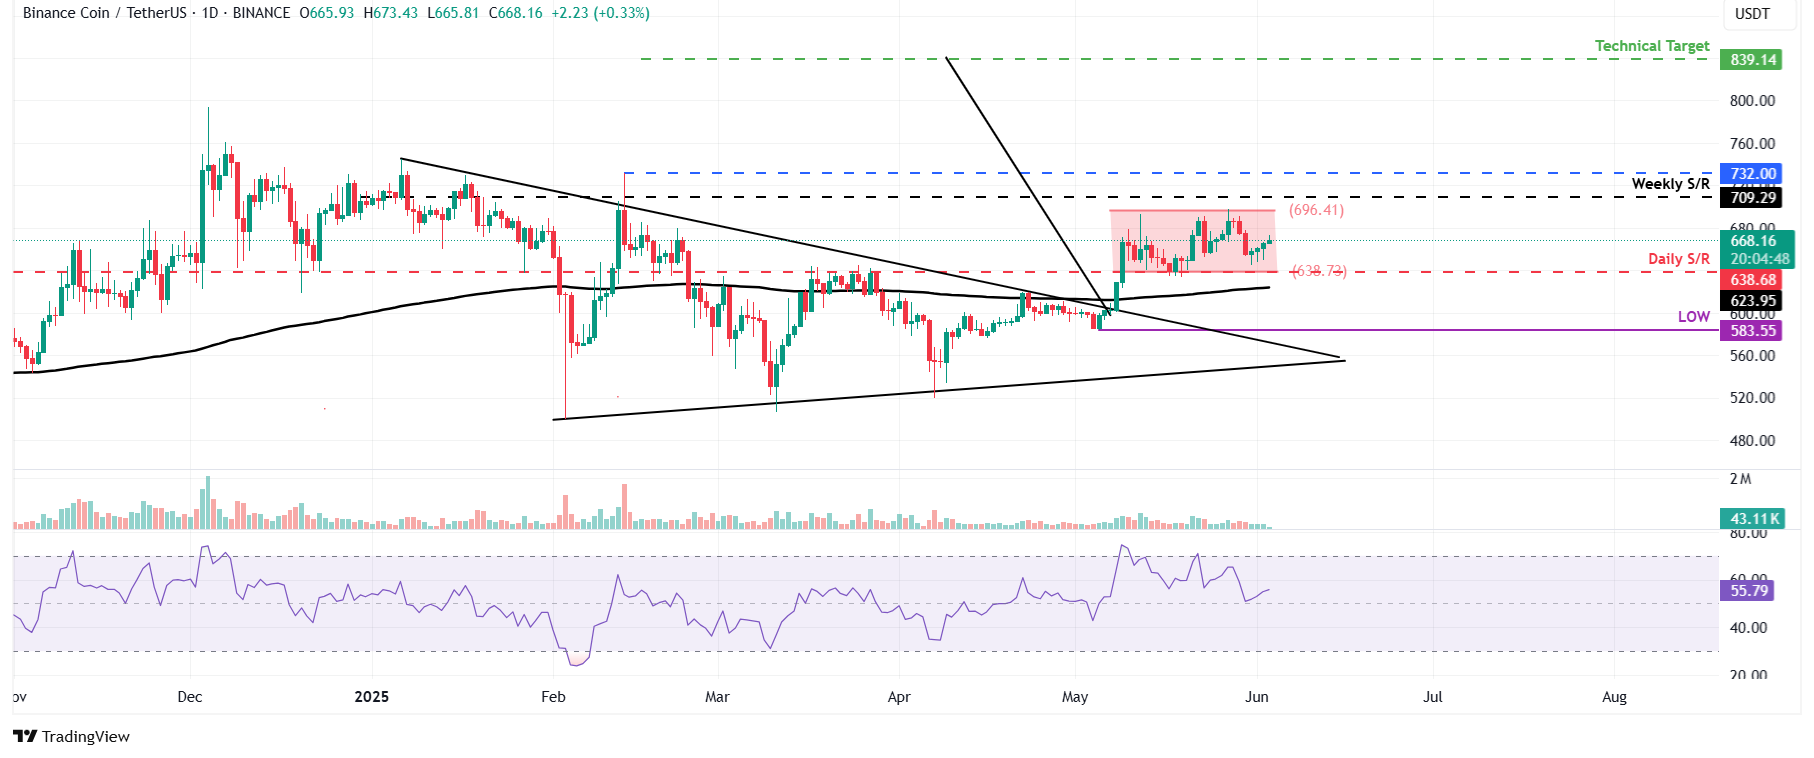
BNB/USDT daily chart
However, if BNB faces a correction, it could extend the decline to retest its lower range of consolidation at $638, which coincides with the daily support level.
Author

Manish Chhetri
FXStreet
Manish Chhetri is a crypto specialist with over four years of experience in the cryptocurrency industry.



