Bitcoin’s slump under $103,000 crashes altcoins: FARTCOIN, ENA, LDO in freefall
- Bitcoin extends its losses amid market-wide risk-off sentiment, with Israel confirming strikes on Iran’s nuclear sites.
- FARTCOIN, ENA, and LDO experience double-digit crashes, reflecting the risk-off sentiment.
- The technical outlook suggests room for a steeper correction if Bitcoin drops under $100,000.

The broader cryptocurrency market risk-off sentiment, as Israel confirms attacks on Iran’s nuclear sites, triggers a wave of profit booking among top coins, leading to Bitcoin (BTC) edging lower by nearly 2% at press time on Friday. With the market leader under pressure, the top altcoins Ethereum (ETH), Solana (SOL), and Dogecoin (DOGE) have declined by nearly 10% in the last 24 hours, while XRP (XRP) has recorded a 6% drop during the same period.
As the crypto market trades in the red, Fartcoin (FARTCOIN), Ethena (ENA), and Lido DAO (LDO) rank the chart with a pullback of nearly 20% in the last 24 hours.
Bitcoin finds support at the 50-day EMA
Bitcoin trades in the red on Friday at press time, briefly dropping under $103,000 to $102,664. With the third consecutive bearish candle, BTC erases the recovery earlier this week and is down nearly 2% so far this week.
Bitcoin marks a short-term recovery as it bounces off the high-demand zone, marked in a green band, above $102,000 and the rising 50-day Exponential Moving Average (EMA) at $104,458. This creates a minor shadow in the intraday candle, projecting recovery chances later in the day.
The Moving Average Convergence/Divergence (MACD) indicates a failed bullish reversal, as it reverses from its signal line without crossing above it. With the resurgence of bearish histograms, the indicator suggests a pullback phase is underway.
The Relative Strength Index (RSI) at 45 steps under the halfway level indicates a loss in bullish momentum. As RSI edges lower towards the oversold zone, it warns of further downside.
A daily close under the 50-day EMA at $104,458 could violate the support zone above $102,000. In such a case, sidelined investors could find an entry opportunity with $100,372, the 30-day lowest trading price, as the next immediate support.
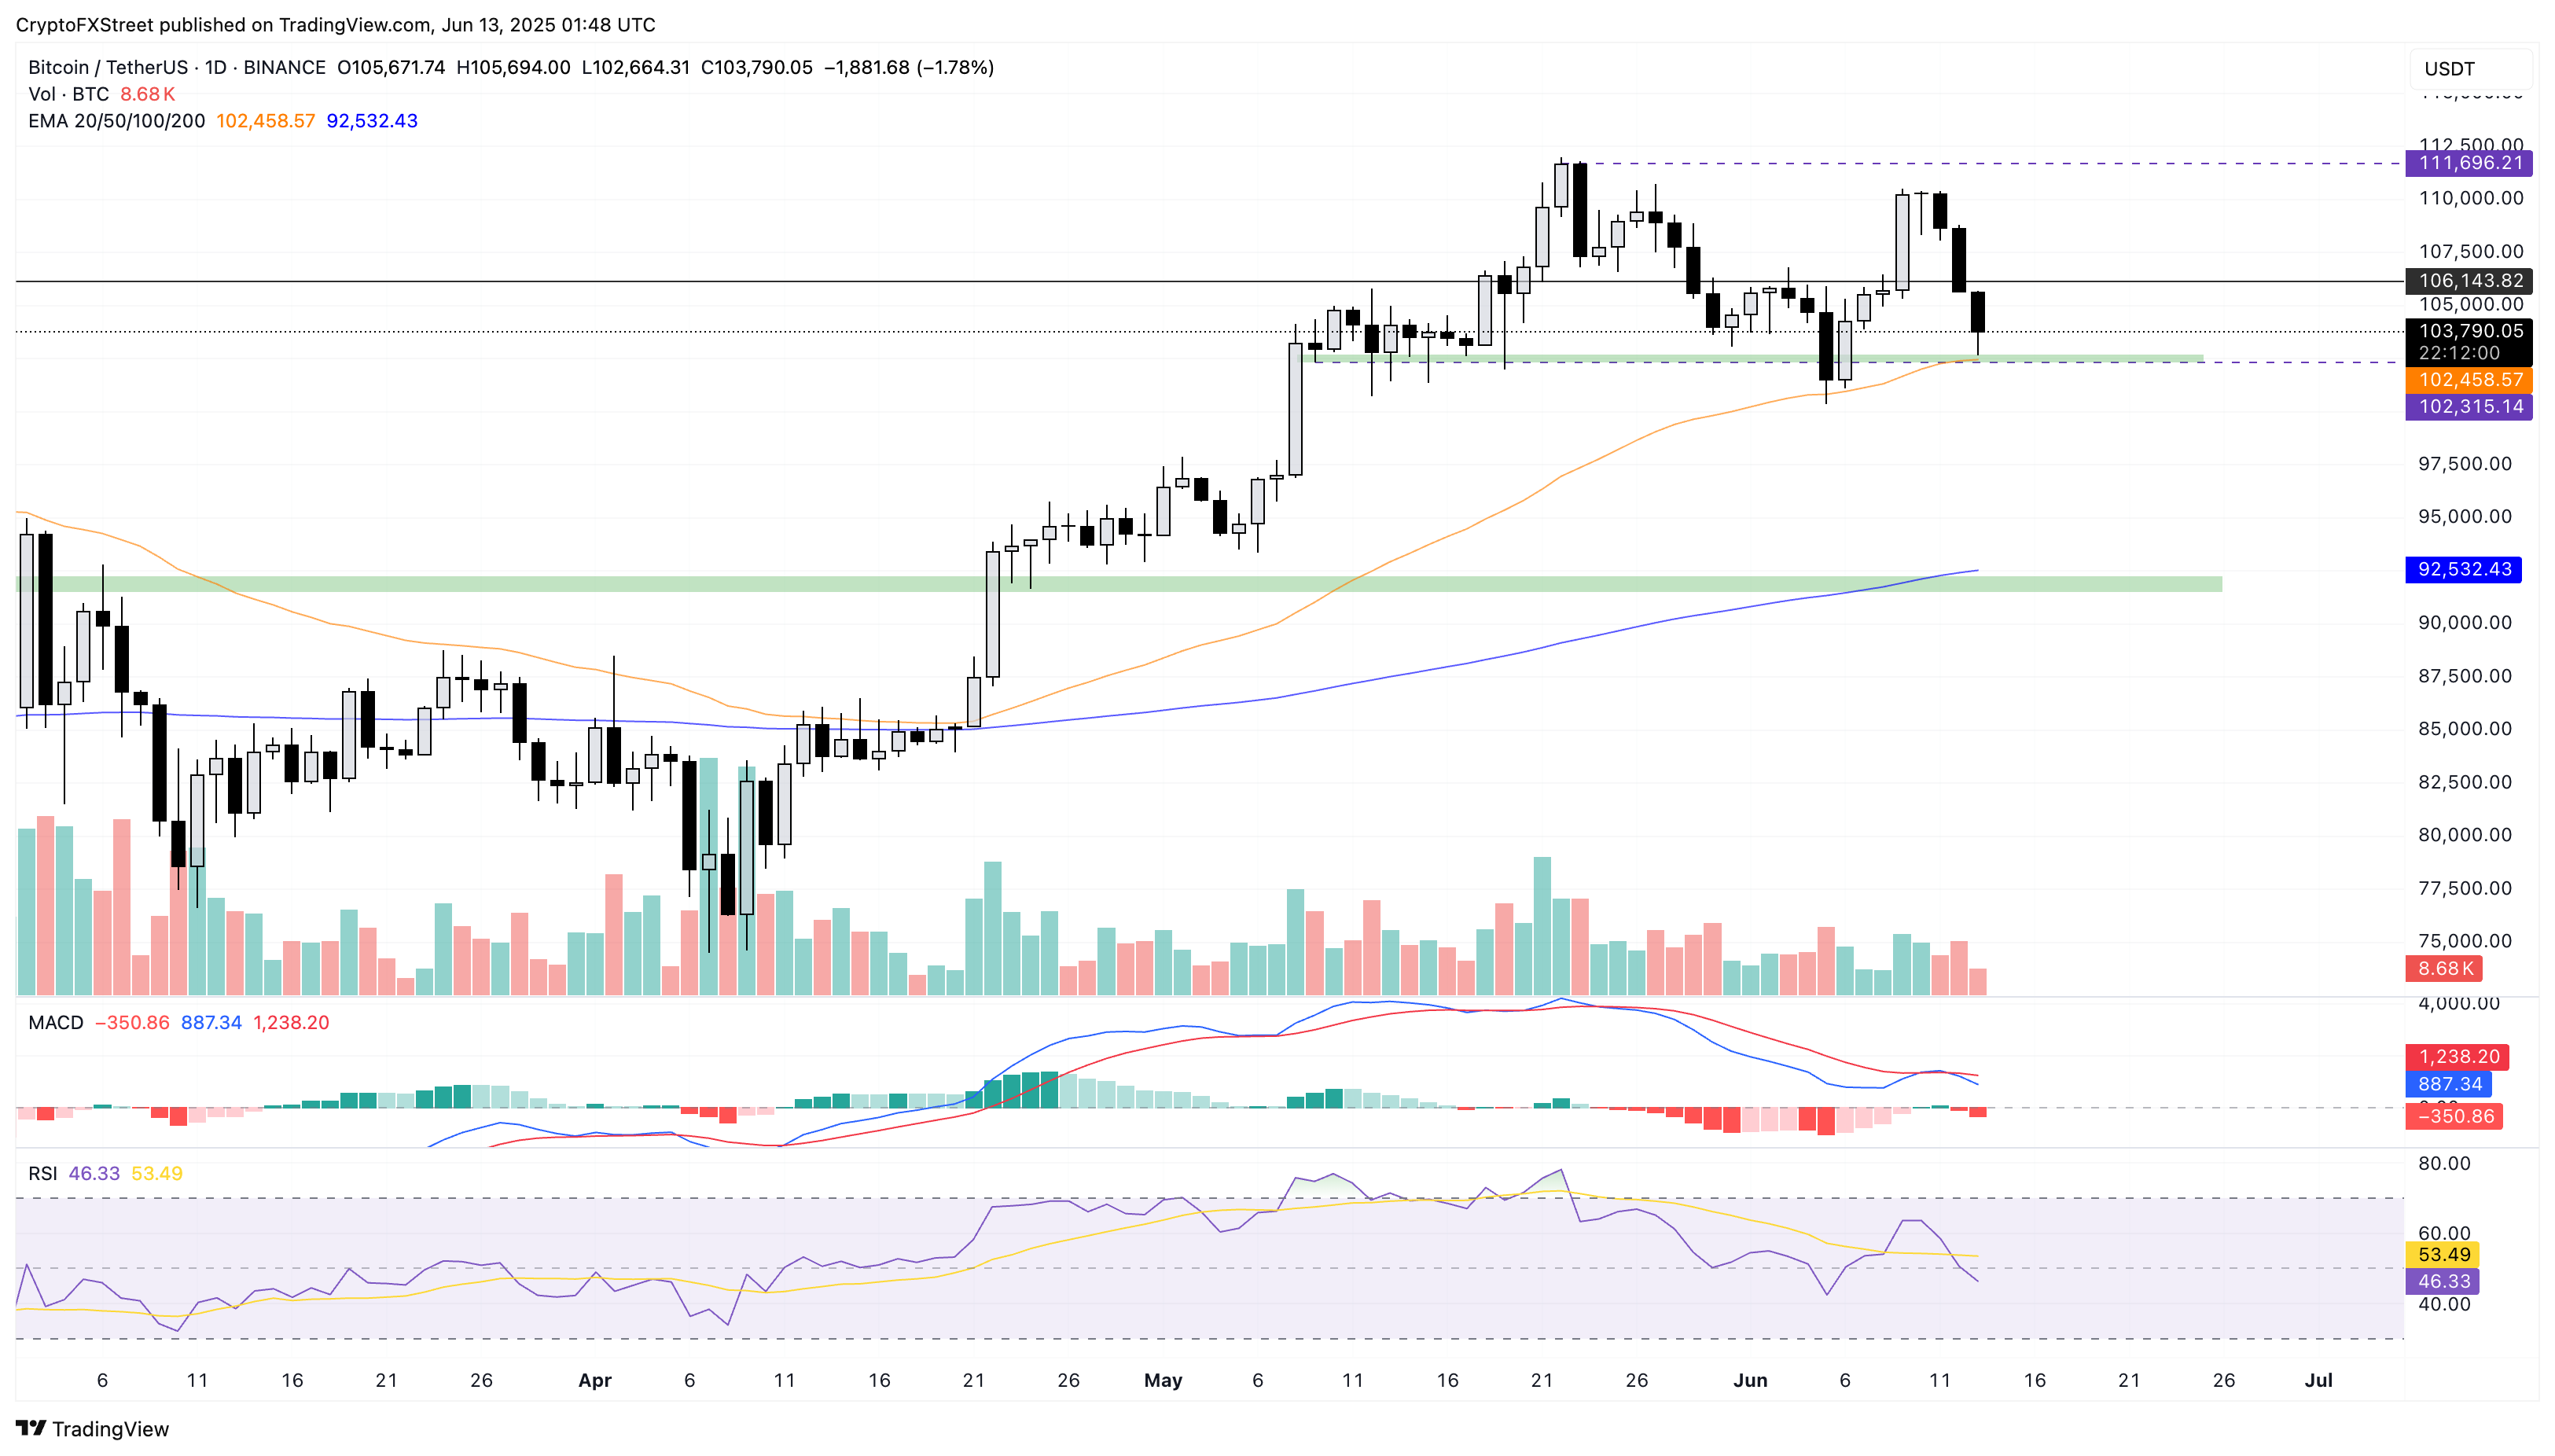
BTC/USDT daily price chart.
However, a recovery later in the day, as Bitcoin upholds the 50-day EMA, could result in a consolidation move before taking a recovery run towards the all-time high of $111,980.
Fartcoin’s reversal risks $1 fallout
Fartcoin marks its third consecutive bearish day, reversing from Wednesday’s high at $1.53. Crossing below its 50-day EMA at $1.13, the meme coin is down by over 10% to $1.09 at press time on Friday.
The momentum indicator suggests a sharp surge in bearish momentum as the RSI at 45 drops below the halfway line and the MACD nears crossing below its signal line.
The immediate support lies at $0.92, marked by the low on May 7, if it breaks below the $1 psychological support level.
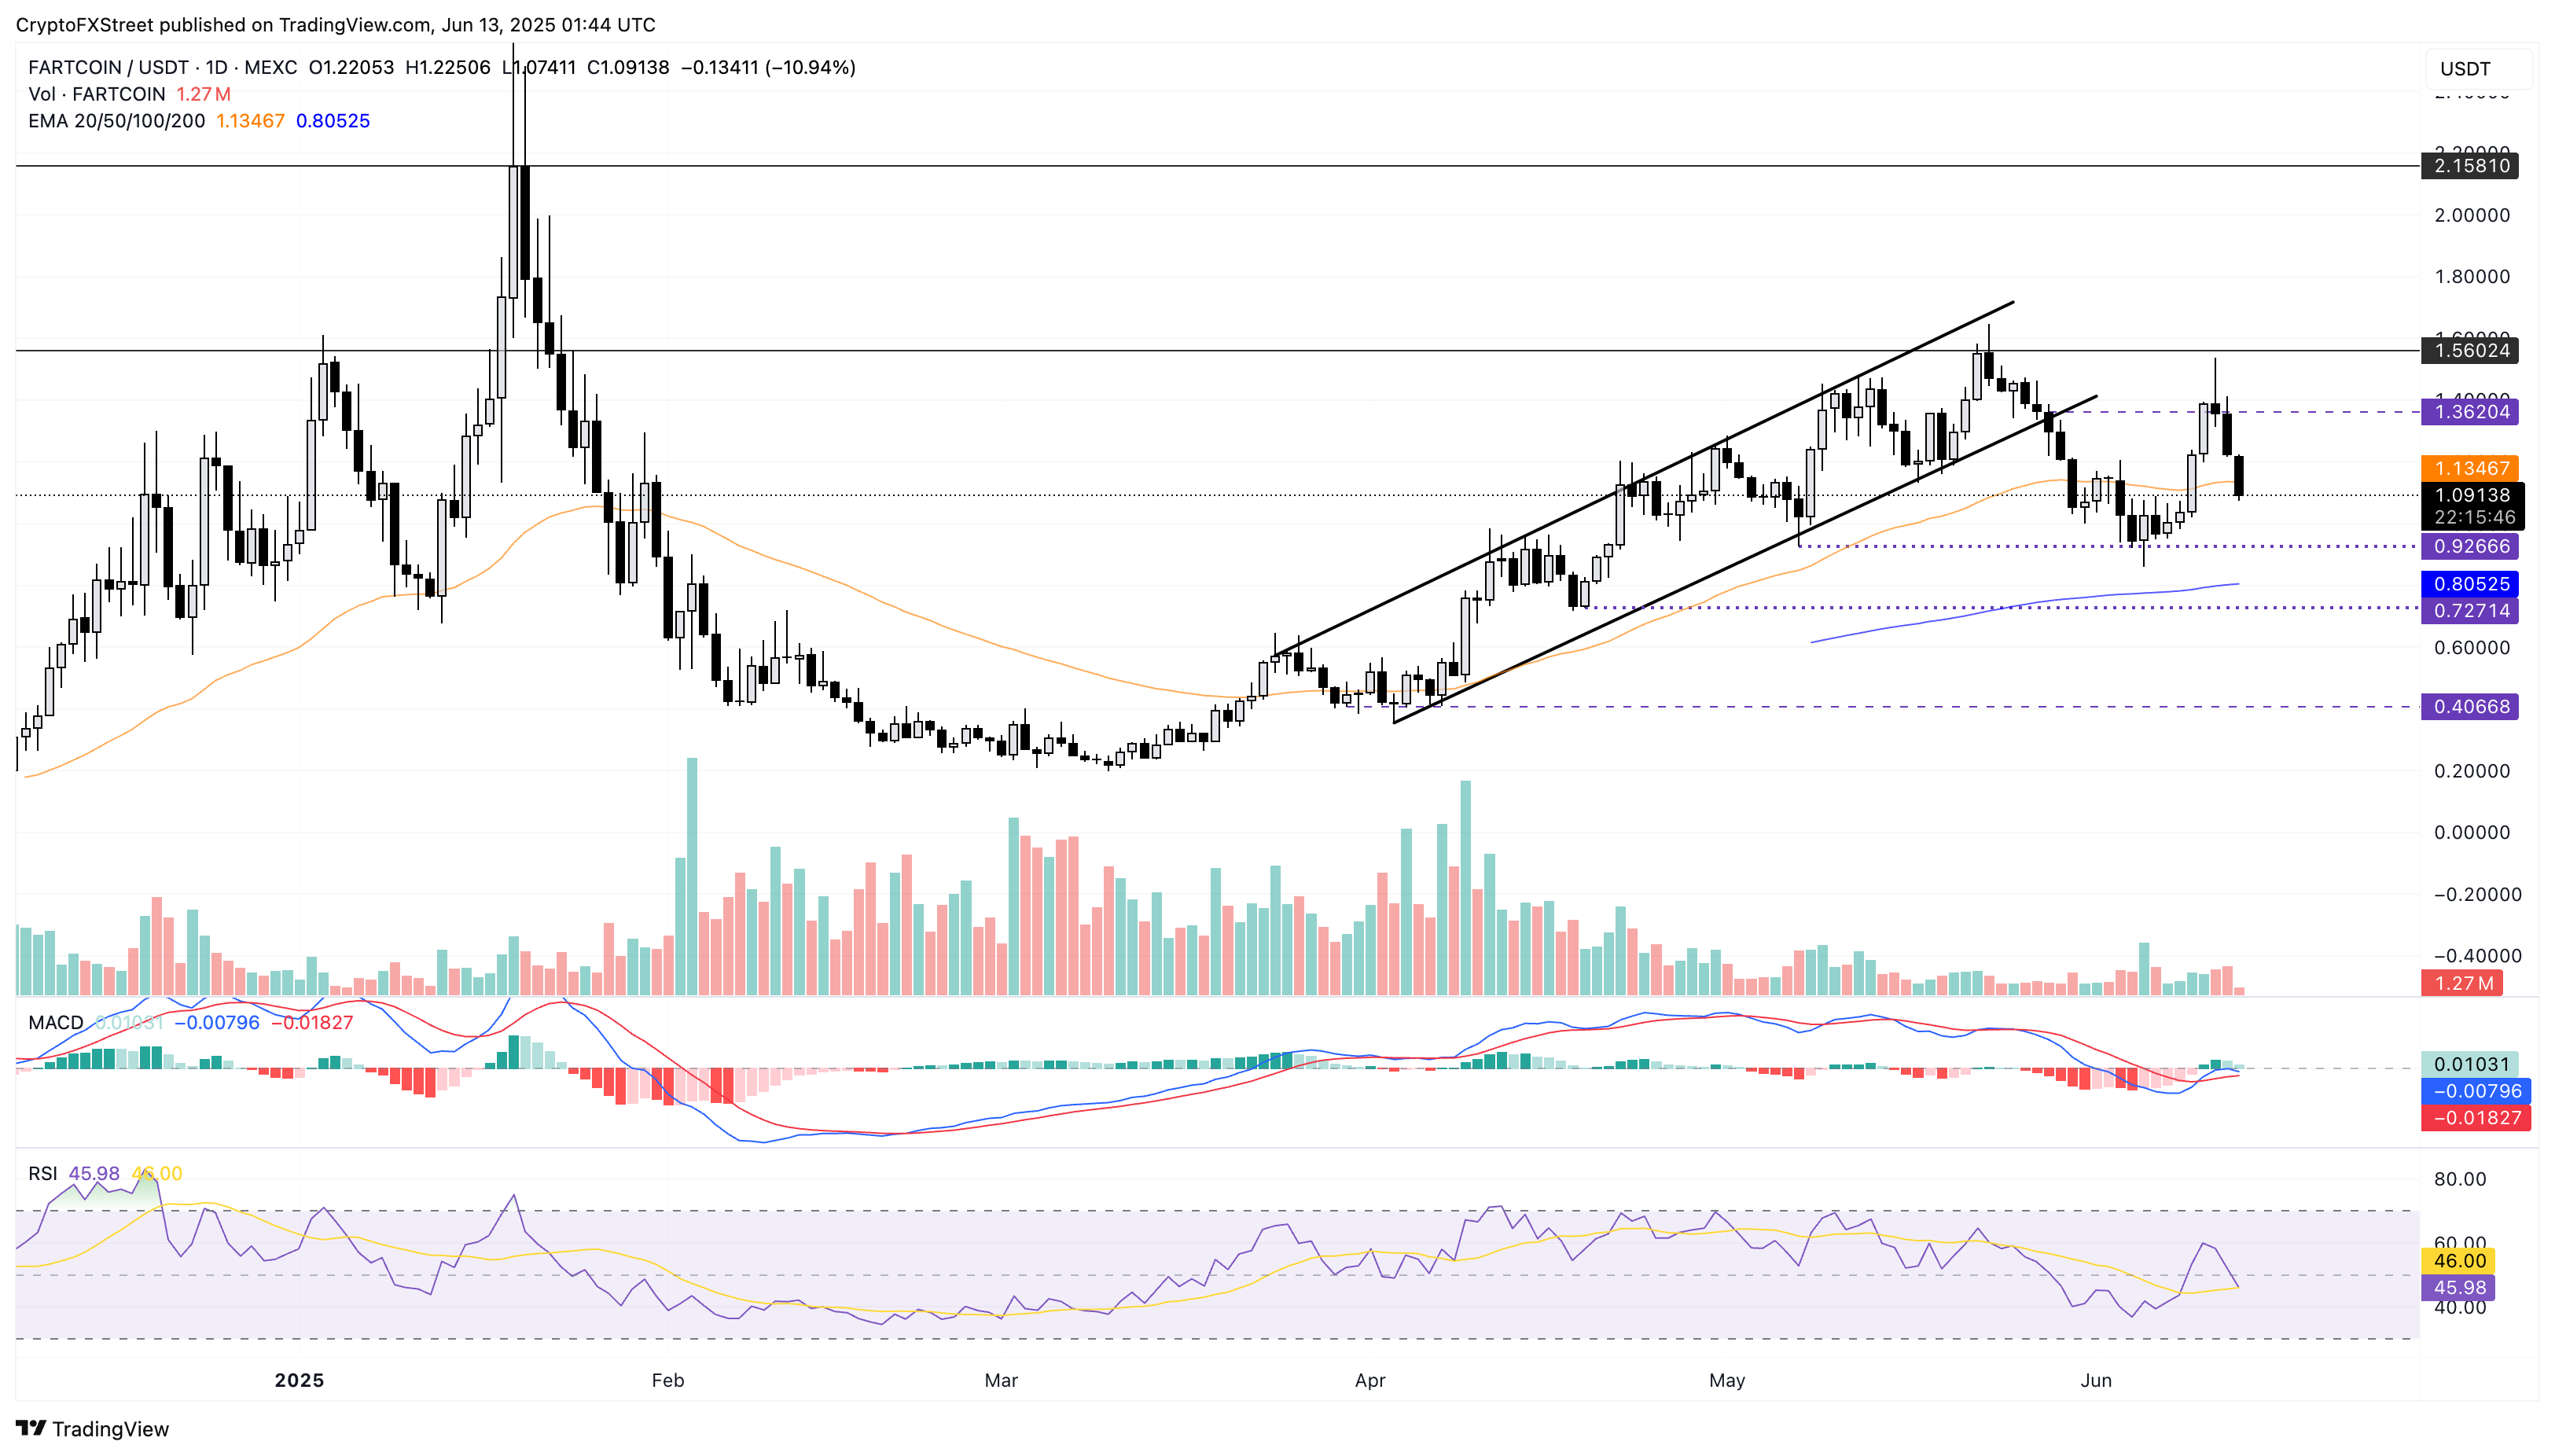
FARTCOIN/USDT daily price chart.
A reversal above $1.36 will nullify the downfall and could result in a surge towards the Wednesday high at $1.53.
Downtrend prolongs in ENA, risks $0.25 retest
Ethena prolongs the lower high trend with the recent reversal from $0.37 on Wednesday. With an over 20% drop in the last three days, ENA tests the support level at $0.28, marked by a low last Thursday.
The momentum indicators on the daily chart show a similar bearish momentum surge to other coins. The MACD indicator drops below its signal line while the RSI at 41 nears the oversold zone.
A closing below $0.28 could test the lowest 30-day trading price at $0.25.
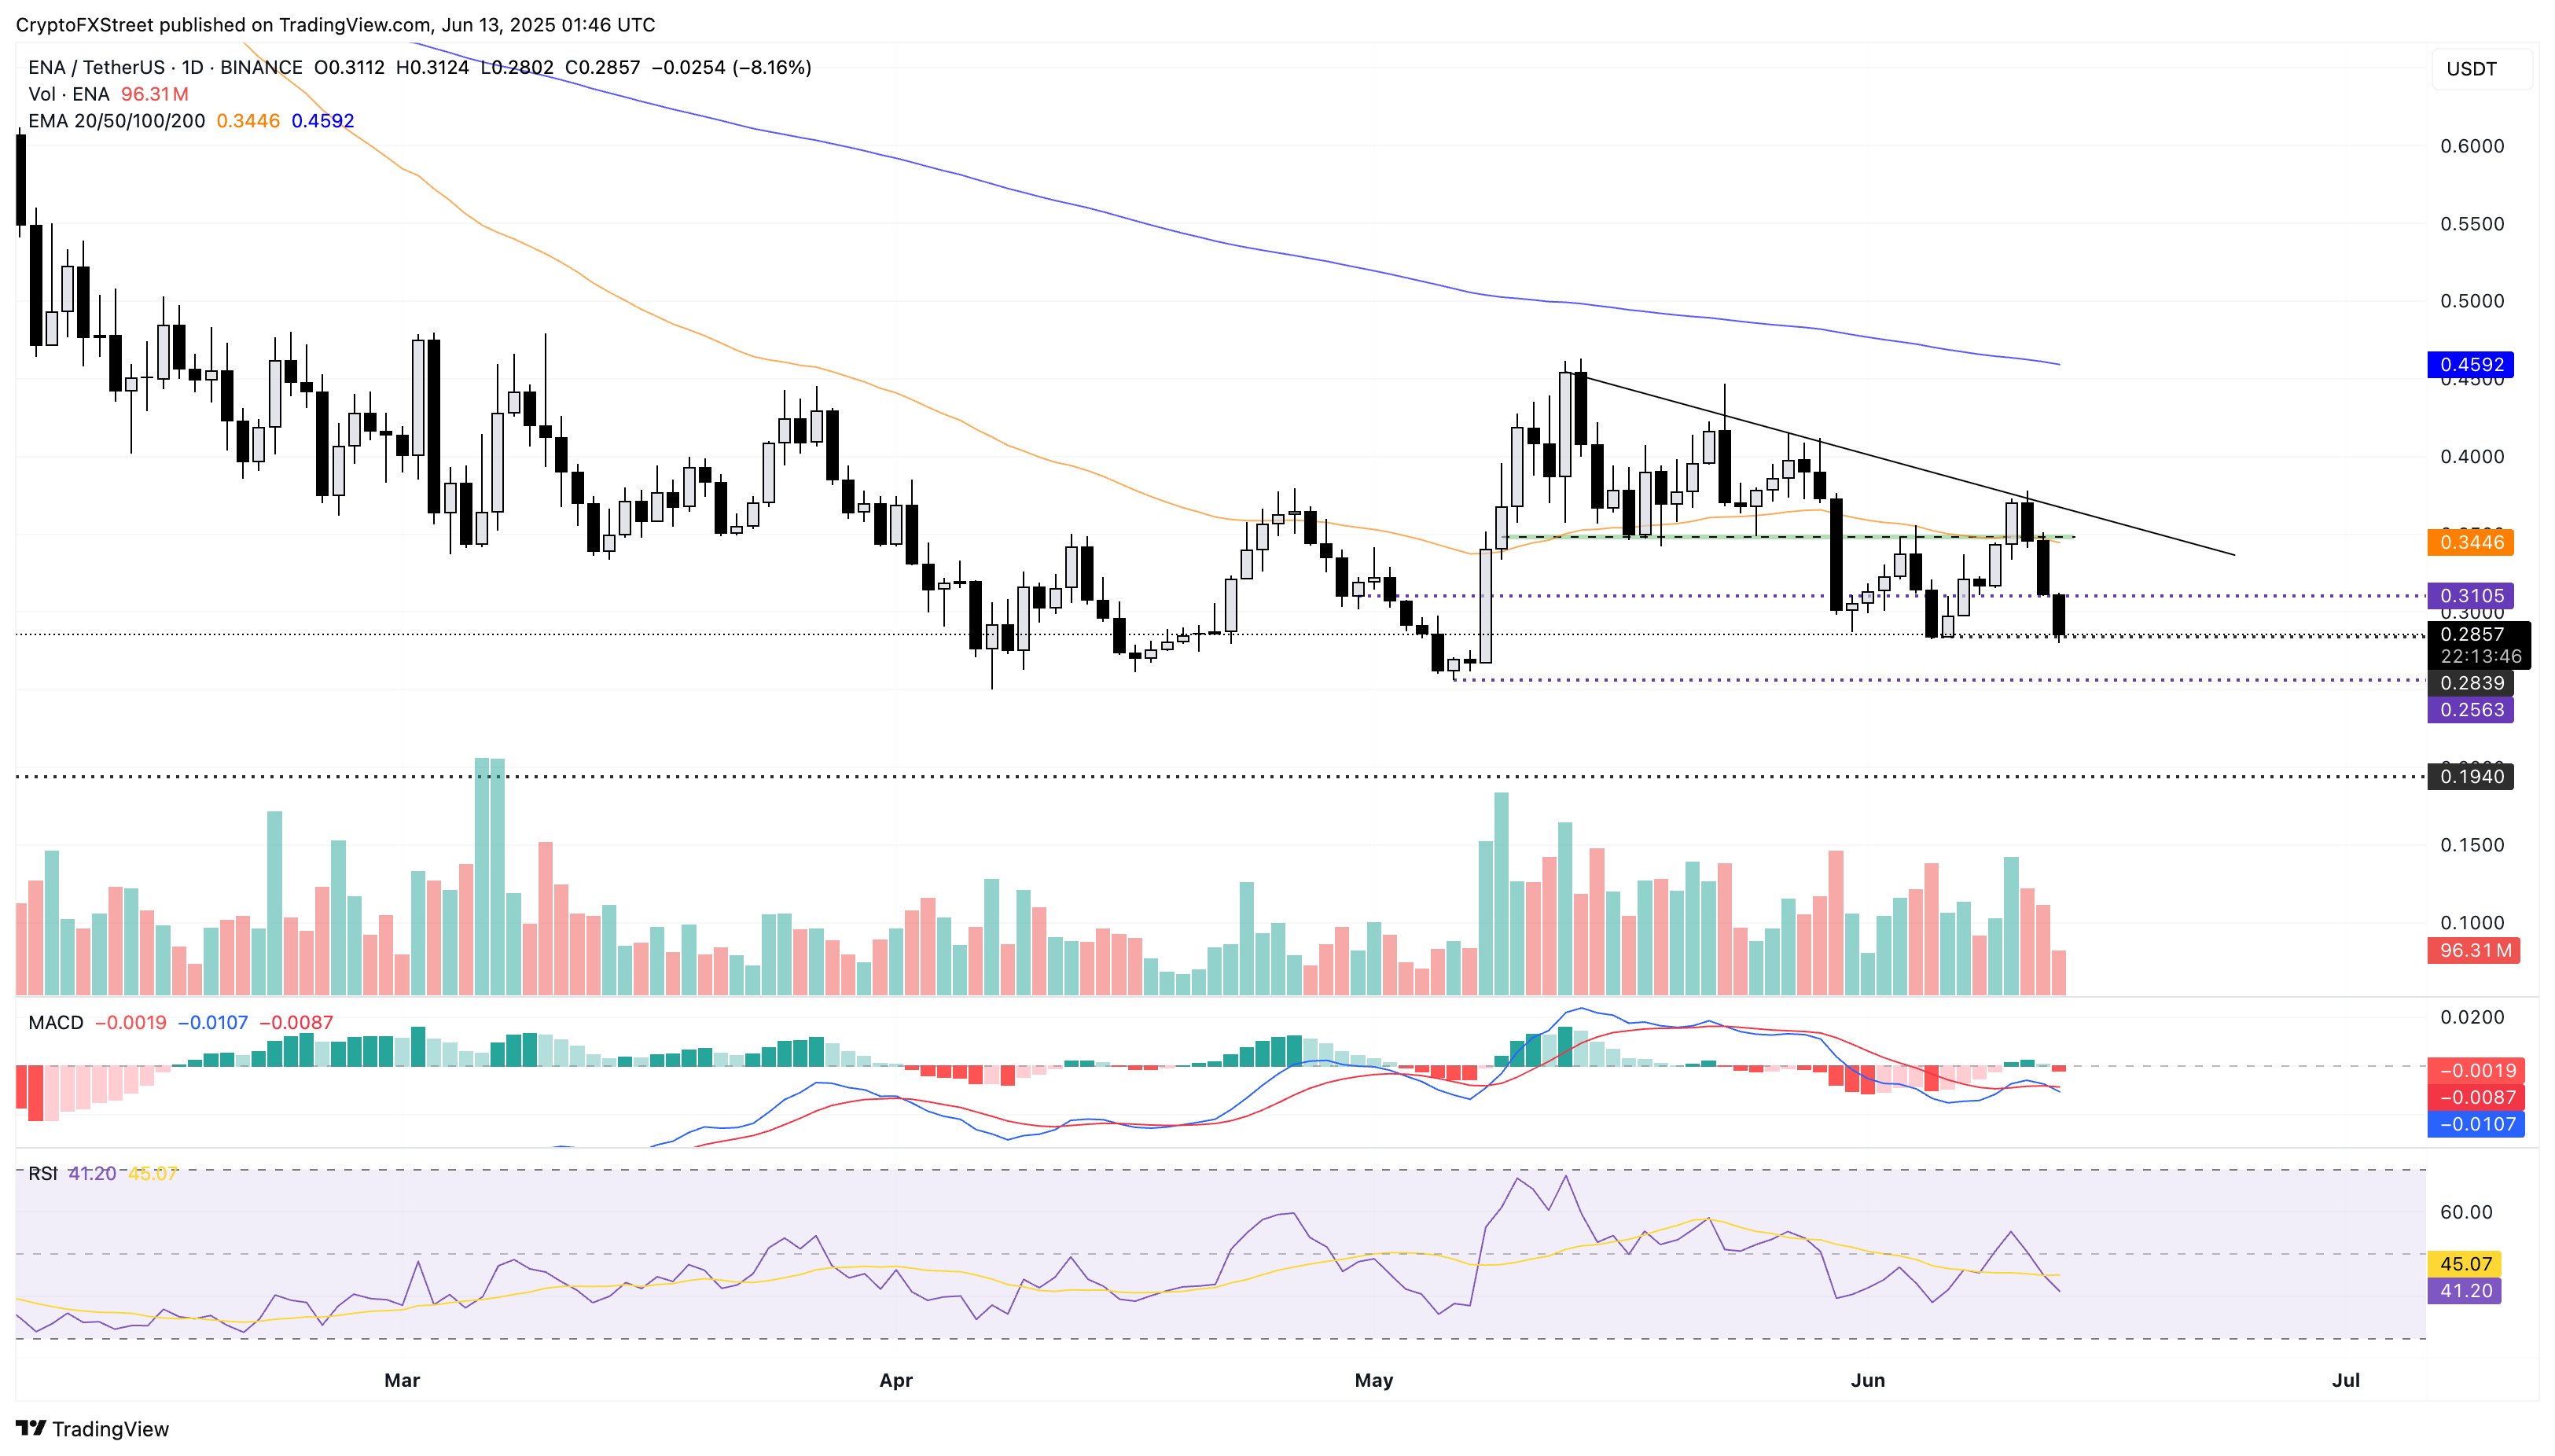
ENA/USDT daily price chart.
A reversal above $0.30 could pause the steep correction, potentially leading to a sideways trend.
LDO nosedives after failed $1 breakout
LDO fails to close above the $1 psychological resistance level despite the breakout of a long-awaited resistance trendline in the daily chart. Closing below the 50-day EMA, the altcoin retests the broken trendline.
The MACD indicator drops towards its signal line for a bearish crossover as the bullish histograms decline. The RSI indicator drops under the halfway level at 44, projecting a sudden decline in bullish momentum.
If the downtrend extends, it could test the $0.74 support level marked by a low on May 6.
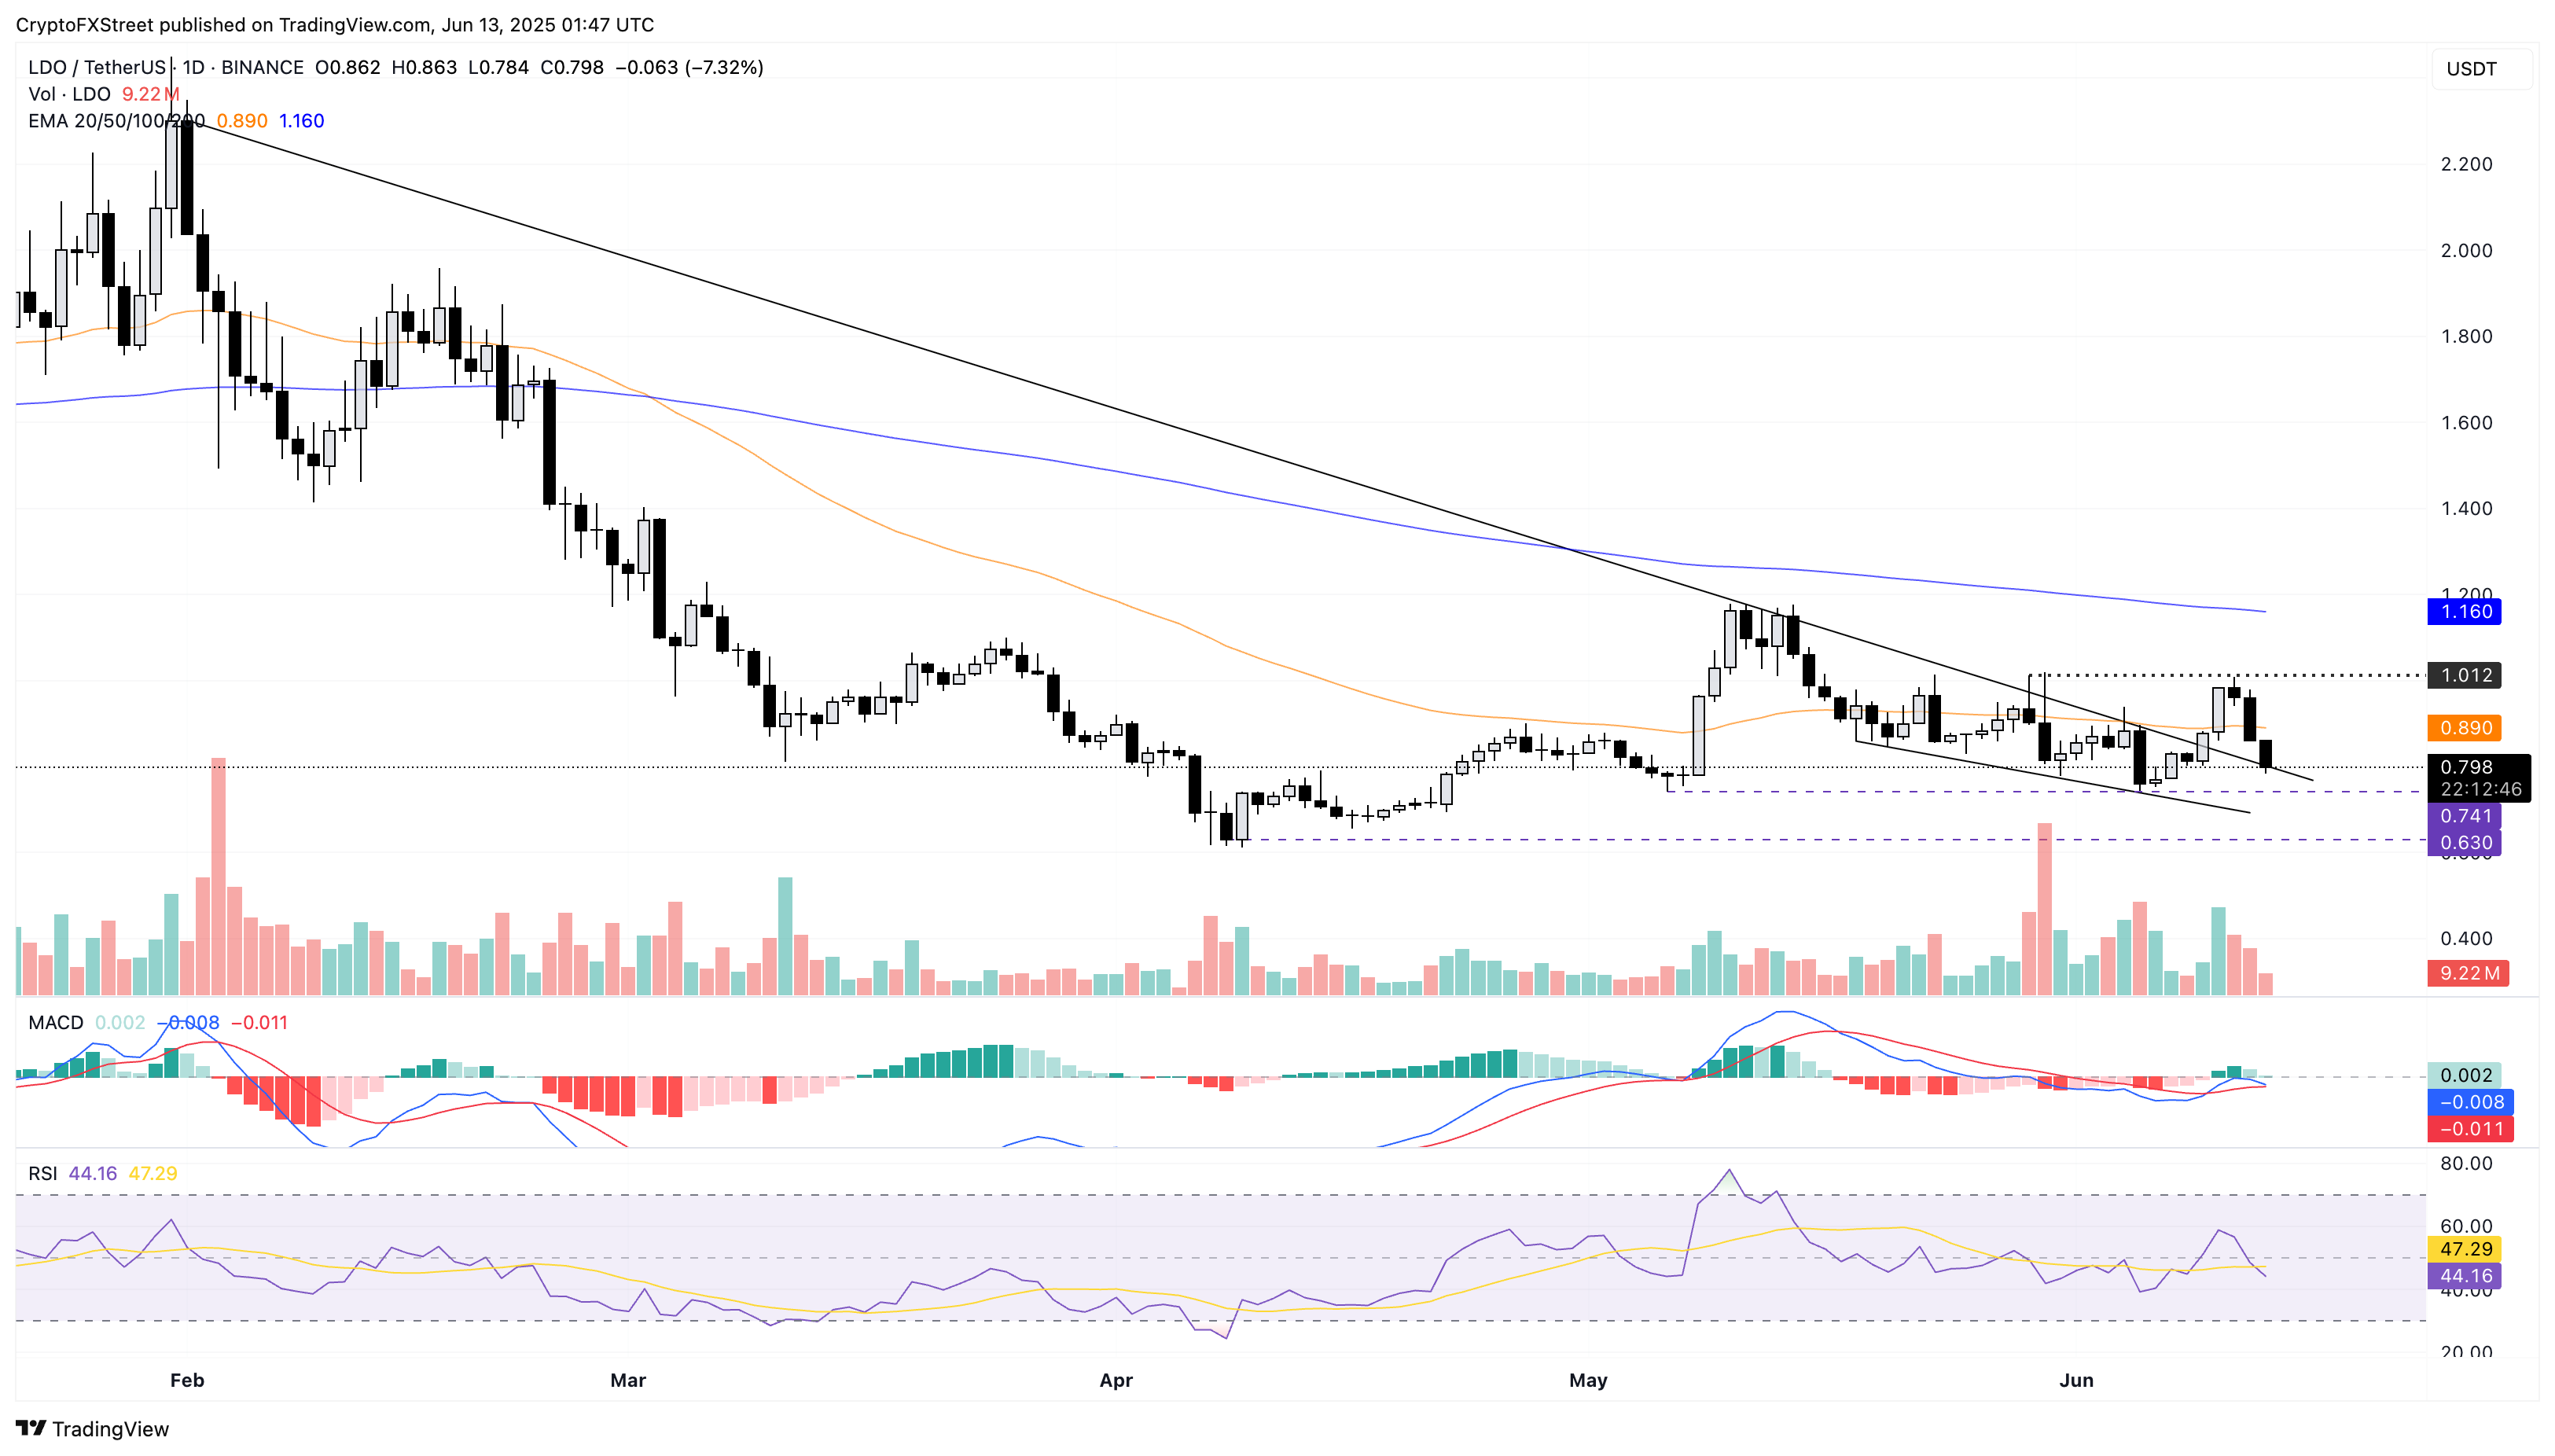
LDO/USDT daily price chart.
However, a reversal above could trend towards the $1 psychological level.
Author

Vishal Dixit
FXStreet
Vishal Dixit holds a B.Sc. in Chemistry from Wilson College but found his true calling in the world of crypto.


