Bitcoin's quiet resilience: Why BTC holds firm while the world wavers

Bitcoin (BTC) – Technical analysis chart
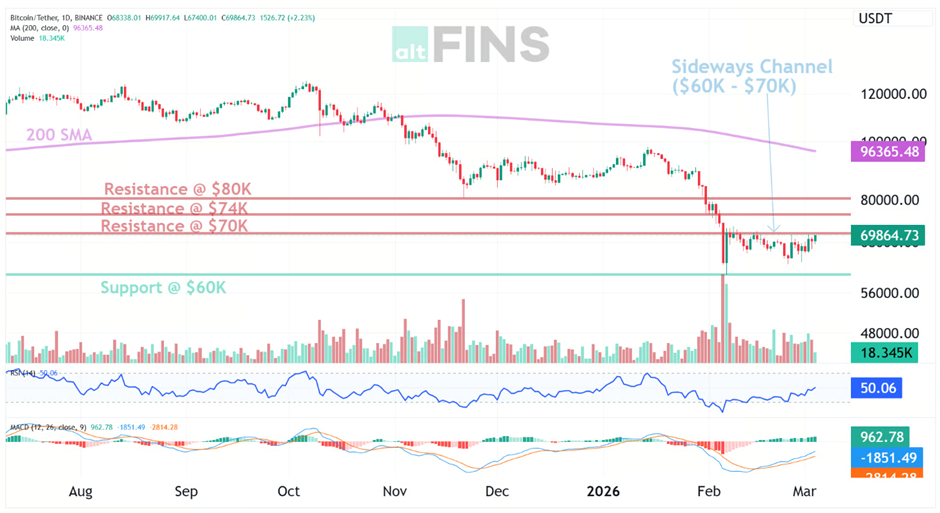
Source: altfins.com
At $71,800 and up 12% in a week, Bitcoin is defying geopolitical headwinds.
The world's geopolitical map looks messier than it has in decades. Trade wars are reigniting, monetary systems are being stress-tested, and trust in traditional financial institutions is eroding. And yet, Bitcoin is up 12% this week.
1. Is BTC a 'safe haven' ?
It initially dipped when the conflict began, but than sharply reversed. Maybe BTC acting like safe-heaven...but that's not usually the case. BTC has traded more like a risk-on asset, a long-duration tech stock. And if oil prices remain high, that could increase inflation, which could delay Fed rate cuts....negative for crypto. Maybe investors think this war will end soon and are dismissing this risk.
2. Technical setup: Breakout from sideways channel consolidation.
After consolidating in a Sideways Channel ($60K - $70K) for weeks, BTC just broke above the $70K resistance where it got rejected a few times recently, and could revisit $74K next. However, this breakout still needs to be tested and confirmed before we can conclude that BTC has reversed its Downtrend. We believe that it needs more time for consolidation...flushing out the sellers, and would be more inclined to buy near $60-62K support then jump on any breakouts above $70K.
3. Smart money: bullish positioning
Data shows cumulative long leverages of $2.9 billion near the $62,000 price level overshadowed corresponding shorts of $554 million, with large buy walls ranging from $62,000 to $68,000, meaning it would take significant selling pressure to push BTC below its current price. Also, ETF outflows have dried up recently. Net inflows into BTC ETFs reached $500 million in February, despite global economic tensions. After massive ETF outflows from November to February, the institutional selling pressure that weighed on BTC for months is simply running out of steam.
4. Catching up with Gold?
Gold is up 80% in 12 months and 20% YTD, while BTC is still down 17% in 12 months and 18% YTD. Some analysts believe that Gold typically leads BTC, which could mean that BTC could be catching up in 2026. Gold's market cap is still 11x bigger than BTC, so there's arguable a ton of upside if BTC's "digital gold" narrative continues to gain acceptance.
Summary
The combination of whale buy walls, drying ETF outflows, institutional accumulation, and a growing "digital gold" narrative among retail investors is creating a genuine floor under the price during crises.
Author

Marek Hric
altFINS
Marek is a finance and capital markets professional with more than 9 years of experience from two top European banking groups. He is skilled in portfolio and risk management with focus on traditional fixed income and derivative financial instruments.


