Bitcoin Technical Analysis: bulls escape, horns are pointing to the north
- Bitcoin price was seen holding modest gains into the second part of Monday's session, in the green by some 0.3%.
- BTC/USD price action hard formed a bullish flag pattern, which has been broken to the upside.
- Near-term supply remains heavy around the $5400-600 range, large momentum needed to break above.

BTC/USD 30-minute chart
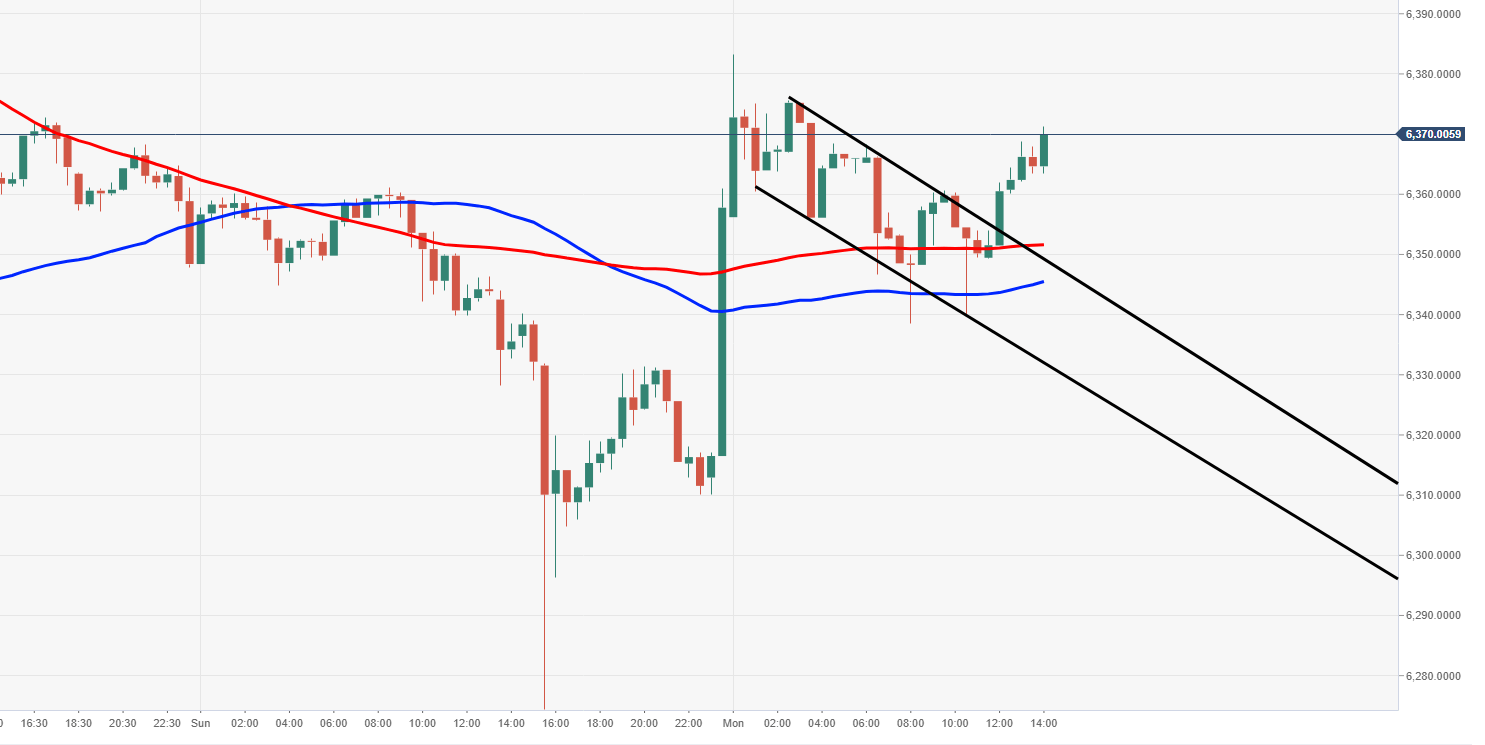
Spot rate: 6365.4
Relative change: +0.30%
High: 6371.0
Low: 6274.4
Trend: Bullish/Neutral
Resistance 1: 6383.0, 12 November high area.
Resistance 2: 6417.8, daily pivot point resistance.
Resistance 3: 6474.4, daily pivot point resistance.
Support 1: 6350.0, 100MA & upper part of bull flag.
Support 2: 6301.1, daily pivot point support.
Support 3: 6244.4, daily pivot point support.
Author

Ken Chigbo
Independent Analyst
Ken has over 8 years exposure to the financial markets. He started his career as an analyst, covering a variety of asset classes; forex, fixed income, commodities and equities.


