Bitcoin Technical Analysis: BTC/USD one small barrier ahead of greater upside
- Bitcoin price on Monday was seen holding decent gains of over 6% into the second half.
- BTC/USD near-term price action is moving within a range-block, must break above $4400-600 area for a new wave of buying pressure.

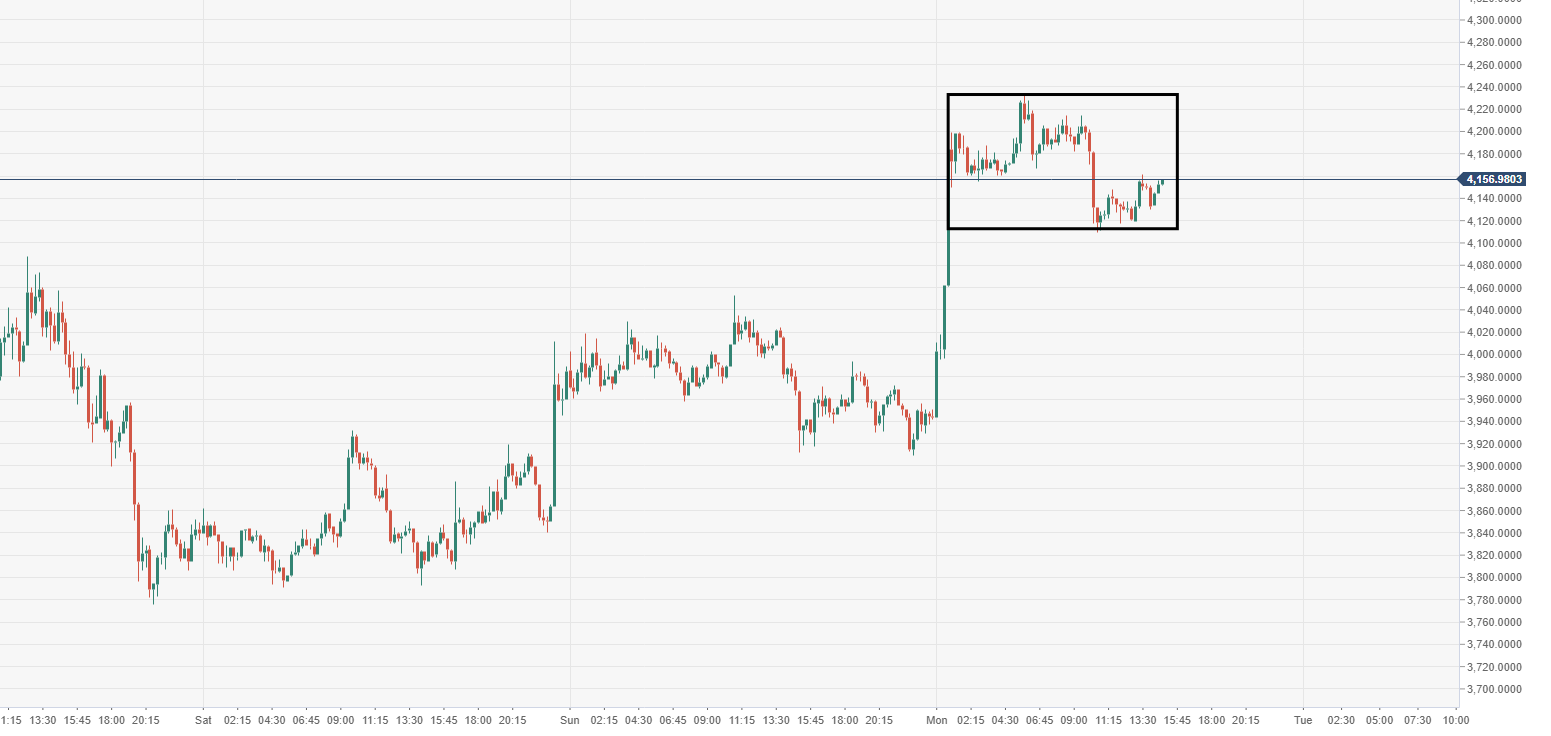
BTC/USD 15-minute chart
- Price action moving within a range-block formation, subject to an explosive move to the upside.
Spot rate: 4195.69
Relative change: +6.40%
High: 4234.51
Low: 3943.62
Trend: Bullish
Resistance 1: 4408.00, 29th November high.
Resistance 2: 4628.50, upper part of supply zone.
Resistance 3: 4888.84, 20th November high.
Support 1: 3884.48, daily pivot point support.
Support 2: 3825.32, daily pivot point support.
Support 3: 3741.24, daily pivot point support.
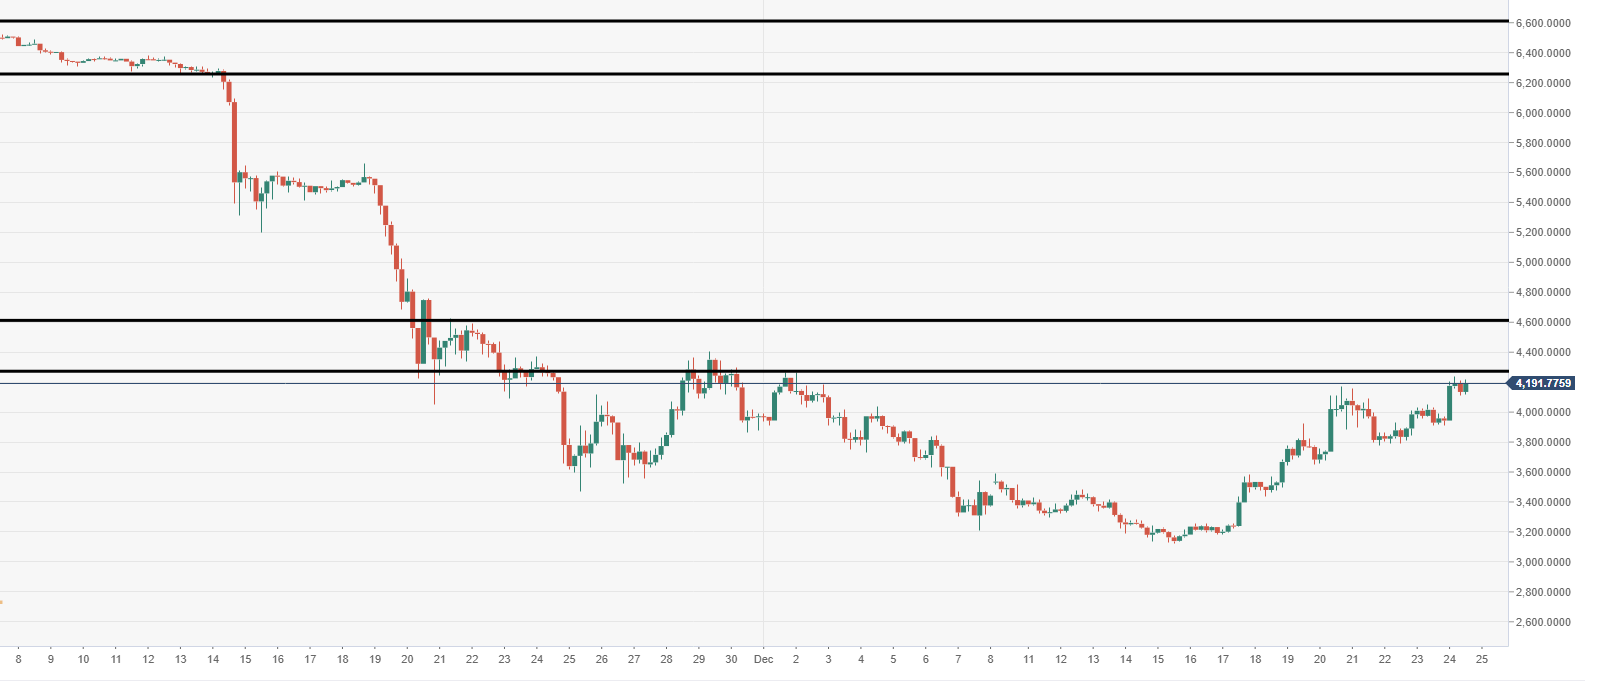
BTC/USD 4-hour chart
- Should bulls move above near-term barrier tracking around $4200-600, a wave of buyers could likely be seen.
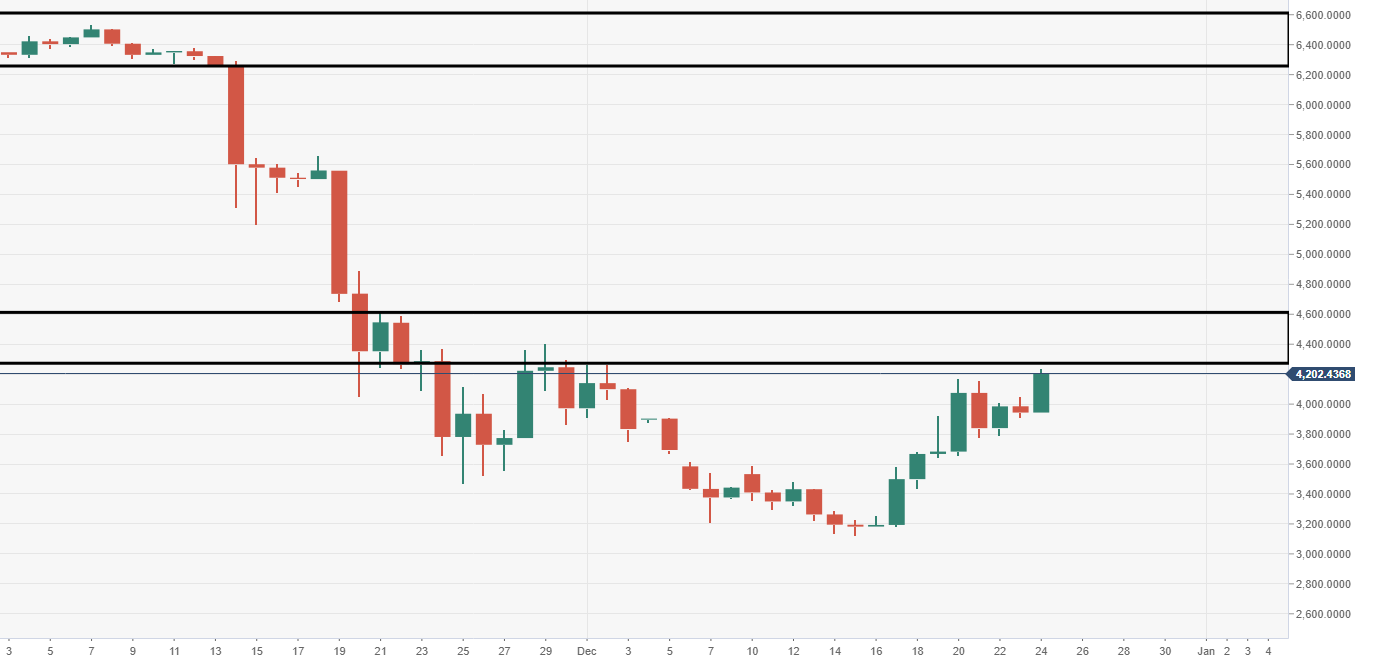
BTC/USD daily chart
- Eyes on a return to the $6000 territory, once the above-mentioned supply area is conquered.
Author

Ken Chigbo
Independent Analyst
Ken has over 8 years exposure to the financial markets. He started his career as an analyst, covering a variety of asset classes; forex, fixed income, commodities and equities.


