Bitcoin price rebound hinges on clearing Fibonacci and EMA confluence near $105,800

Bitcoin price began Monday’s European session by staging a mild rebound at $105,500, after last week’s 5.5% drop from $109,000 to $103,200.
That retracement pulled price below the 0.786 Fibonacci level of the rally that ended at the all-time high of $112,000, signalling profit-taking into month-end.
Highlights
- Bitcoin begins June near $105,500 after May’s 11% close.
- Golden ratio and 100 EMA near $105,800 cap early gains.
- Breakout above $107,000 may confirm bullish continuation.
Despite the late-May weakness, Bitcoin still closed the month with an 11 % gain, building on April’s 14% rise. That two-month strength suggests the broader bullish structure is still valid, but recent developments now place heavy emphasis on reclaiming critical resistance zones to sustain upward momentum.
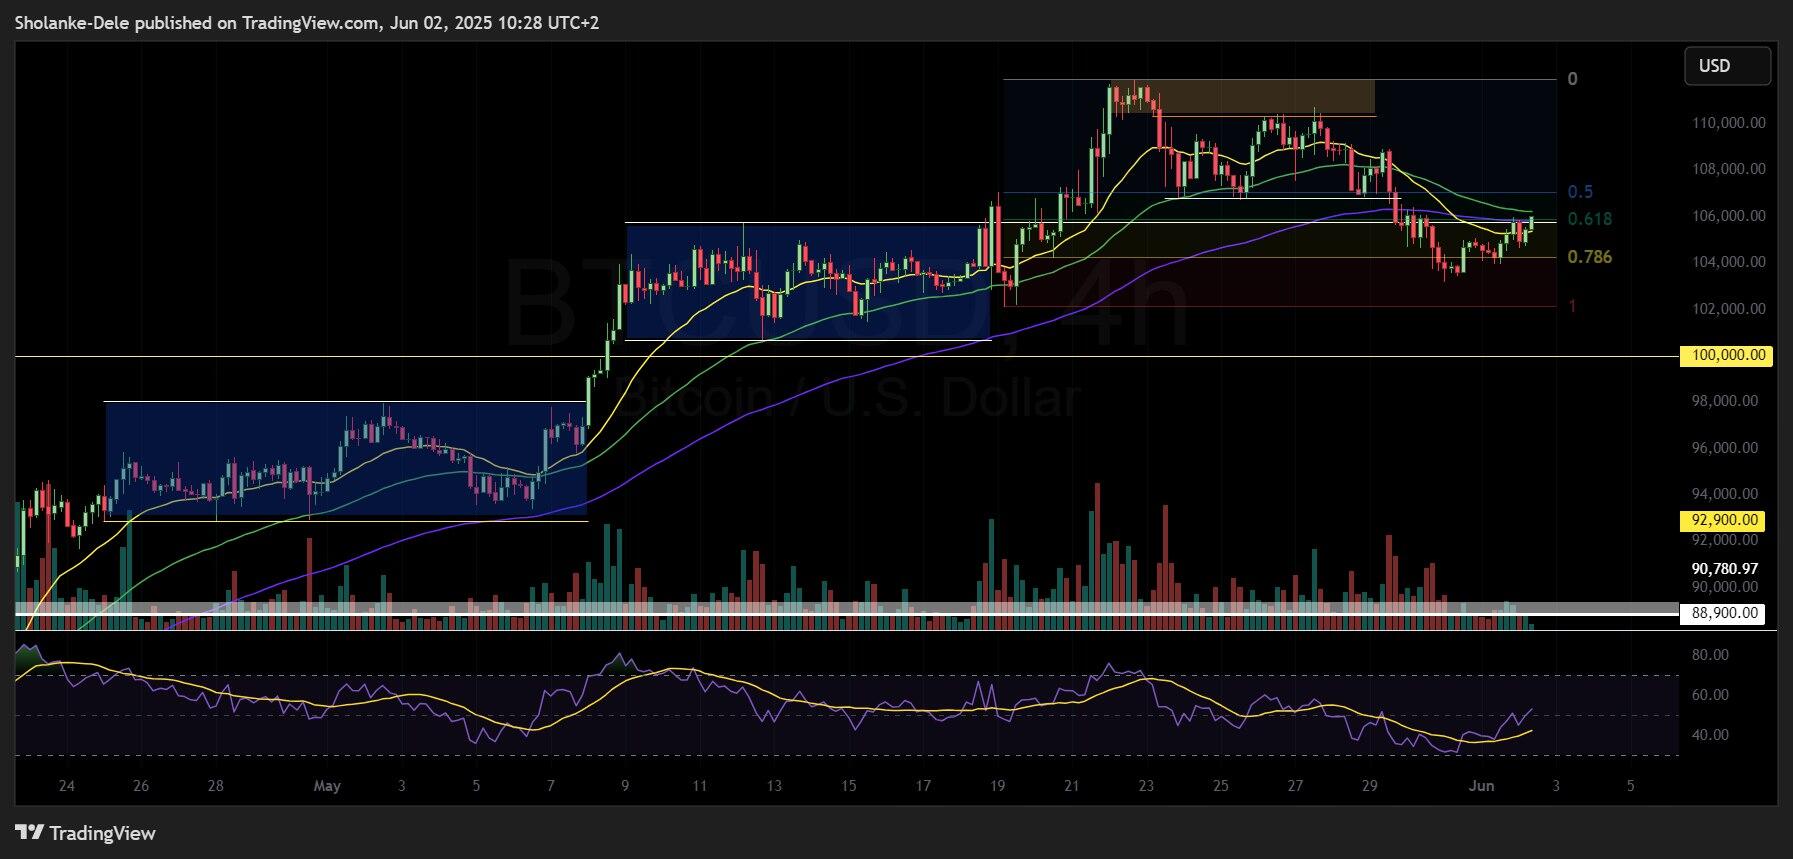
BTC price dynamics (April - May 2025). Source: TradingView
Price rebounded from $103,200 over the weekend, reclaiming the 0.786 Fibonacci level. But today’s Asian session selloff found resistance near $105,800, a level that coincides with both the 0.618 Fibonacci retracement, commonly known as the golden ratio, and the 100 EMA on the 4-hour chart. This confluence marks the most immediate barrier for bulls.
Bitcoin rally depends on clearing $106,000 and invalidating the EMA death cross
As the European session opens, Bitcoin attempts another retest of this resistance zone. But upside remains constrained by the bearish crossover structure on the 4-hour chart, where the 20 EMA crossed below both the 50 and 100 EMA following last week’s slide. Although the 20 EMA has been reclaimed at $105,350, the 50 EMA at $106,000 is the next hurdle before further upside can be considered.
Momentum also reflects indecision. The RSI holds around 50, indicating neither overbought nor oversold conditions. This supports the idea of a key inflection point, where the next move will depend on whether price breaks above the golden ratio or slips back toward support.
If bulls fail to reclaim the $106,000 to $107,000 resistance band, downside could revisit the previous week’s low at $103,200. A break above $107,000, however, would likely confirm a broader bullish continuation for early June.
Bitcoin price dropped to $104,750 and tested the key Fibonacci zone before rebounding. A death cross on the 4-hour chart increased the risk of further decline.
Author

Traders Union
Traders Union
Traders Union is a leading financial portal dedicated to empowering traders and investors with essential information to maximize their success in the financial markets.


