Bitcoin Price Analysis: Bulls don't give up as BTC fails to capitalize on the stock market rally
- The US stock markets are on retreat after a short-lived recovery.
- Bitcoin may be vulnerable to external shocks.
- The technical and on-chain data reveals Bitcoin's bullish potential.

The global stock markets retreated after a wild rally on Monday, caused by the news that Donald Trump returned to the White House. The US President spent three days at a military hospital as he received treatment for Covid-19. The aides and official plan to restrict the physical access to Trump as he continues recovering.
After a massive relief rally, investors on the S&P 500 hit the pause button, resulting in the biggest single-day gains in almost four weeks. Experts believe that the global markets are still vulnerable to another wave of risk-aversion. The level of uncertainty about Trump's health condition and willingness to abide by constraints raises many unanswered questions.
Mark Haefele, chief investment officer at UBS Global Wealth Management, commented:
"As the fourth quarter gets underway, investors face an uncertain outlook. Political uncertainty has moved center stage in the final run up to the US election, with President Trump's positive test for Covid further clouding the picture."
Apart from that, the markets are waiting for progress on a new US economic stimulus package. The stock markets are likely to get another powerful boost if the package is approved, or at least there are positive developments; otherwise, the market may resume the downside correction.
Bitcoin fails to follow the stock's lead
Bitcoin (BTC) showed little interest in Trump's health conditions and failed to demonstrate a strong recovery despite the spectacular rally on the US stock markets. The flagship cryptocurrency stayed locked in the range of $10,600-$10,800 and hit the intraday high of $10,800 on Tuesday before retreating to $10,730 by press time.
Bitcoin's market value is hovering below $200 billion, which is 58.1% of the total capitalization of all digital assets in circulation, according to CoinMarketCap. Since the beginning of August, the metric has stayed below 60% as the DeFi boom gave rise to numerous new coins.
Where from here
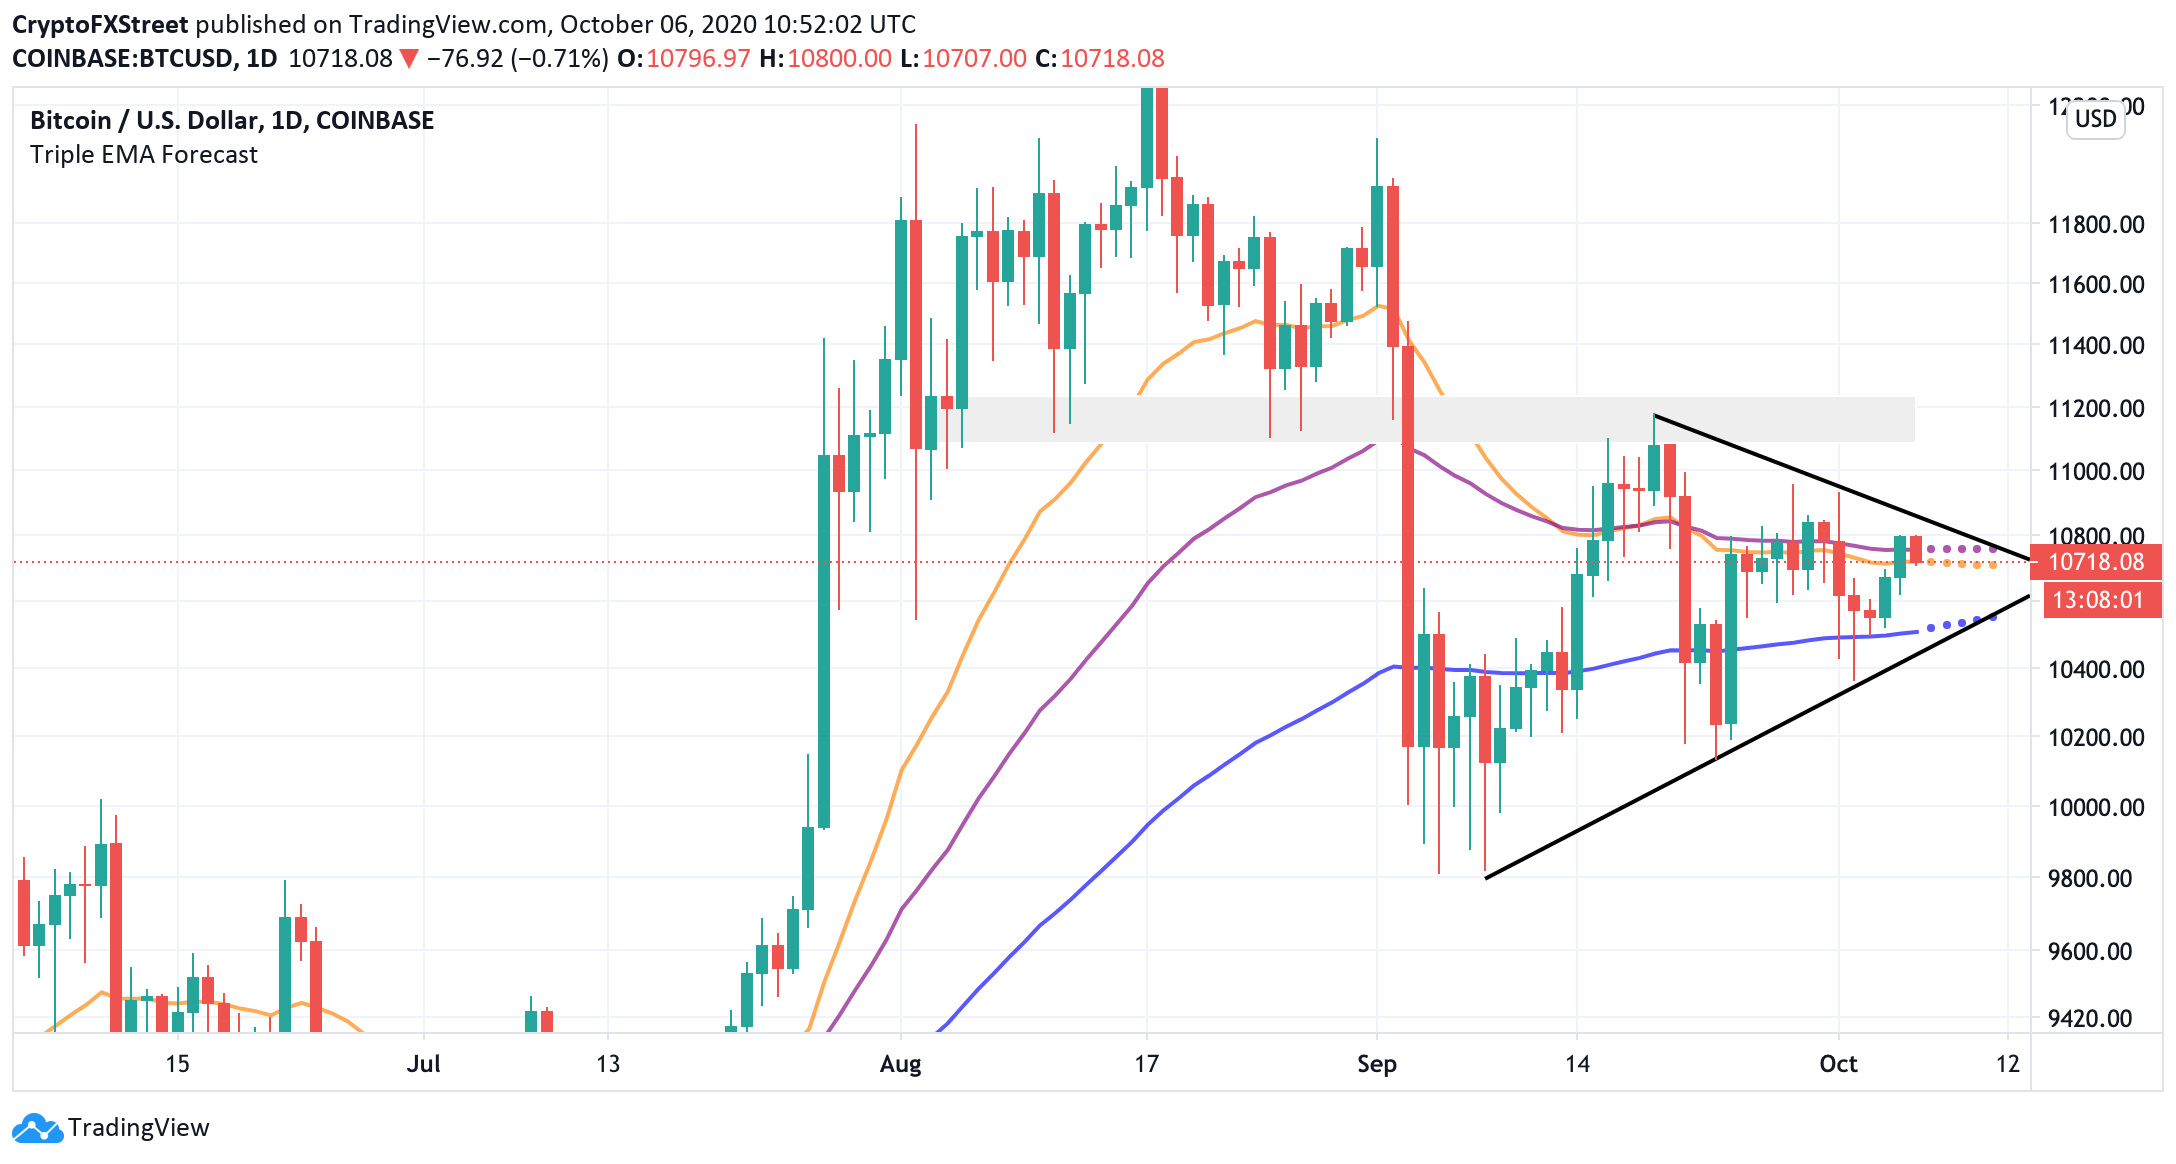
Currently, BTC/USD recovery is limited by the local resistance of $10,800. This barrier is reinforced by the upper line of the symmetrical triangle on a daily chart. A combination of the short-term and mid-term EMAs (exponential moving averages) clustered around the current price presents an additional challenge for BTC bulls.
This area served as an intraday high both on Monday and on Tuesday, and once it is broken, the recovery may be extended towards the area of $11,000-$11,200 that stopped Bitcoin's buyers in the middle of September.
BTC/USD daily chart
Meanwhile, Intotheblock data on the market positioning suggests that a cluster of sell-orders at $10,750-$11,000 has the potential to limit the recovery; however, considering the magnitude of buy orders right below the current price, the upside looks like a path of least resistance at this stage.
Bitcoin's In and Out of the money data
 Analytics and Charts-637375786928697481.png)
Source: Intotheblock
Note that over 1.5 million BTC were bought at a price from $10,400 to $10,700. This supply wall stands ready to protect BTC from falling below $10,400, the critical level we mentioned in our previous analysis. Once it is out of the way, the sell-off will likely start snowballing with the next aim at $10,000-$9,700 and $9,100-$9,000.
Another on-chain metrics, the Market Cap to Thermocap Ratio, supports the idea fo the imminent bullish breakthrough. This figure shows if an asset is trading at a premium to the network's total revenue. Basically, thermocap is another term for cumulative miner revenue that can serve as a crypto version of valuation to revenue metric.
According to data scientist Rafael Schultze-Kraft, the value of the metrics implies that BTC has a huge unrealized bullish potential.
The Market Cap to Thermocap Ratio suggests that #Bitcoin has massive room to grow from here.
— Rafael Schultze-Kraft (@n3ocortex) October 5, 2020
It has not even started to show the sharp increase that is typical in bull markets.
Current levels are a whole order of magnitude away from previous $BTC tops.https://t.co/hNYiaOsaPH pic.twitter.com/j85mPGNJn0
On the other hand, the BTC rally may be derailed by another massive sell-off on the stock markets. The global financial and economic situation is brimmed with uncertainties, making the cryptocurrencies vulnerable to external shocks.
Read our extensive long-term analysis on BTC to know more about critical risks to BTC rally.
To conclude: BTC/USD failed to clear the critical support despite the rally on the stock markets; however, the technical picture implies that the cryptocurrency has unrealized bullish potential. The local resistance is created by $10,800, but a more substantial barrier waits for BTC bulls at $11,000, which needs to be taken out for a sustainable recovery.
On the other hand, external shocks may push the flagship cryptocurrency's price towards the lower line of the current range of $10,600, followed by the critical support of $10,400. A sustainable move lower will invalidate the immediate bullish scenario and bring $10,000 into focus.
Author

Tanya Abrosimova
Independent Analyst



