Bitcoin Price Analysis: BTC/USD jumps up after charting morning star pattern this Wednesday
- BTC/USD broke above the SMA 50 curve this Wednesday in the daily chart.
- The RSI indicator in the hourly chart is crawling along the edge of the overbought zone.

BTC/USD daily chart
-637232033474023730.png)
BTC/USD bulls remain in cruise control after the price went up from $7,137 to $7,147.20 this Wednesday. Before this, BTC/USD finished charting a morning star pattern this Tuesday when it bounced up from the upward trending line and flew up from $6,855.70 to $7,137 – going past $7,000. In the process, the price managed to break above the SMA 20. The bulls are aiming to conquer the $7,354.85 resistance line before it gets checked by the upper curve of the 20-day Bollinger Band. The MACD indicates sustained bullish momentum, while the Elliott Oscillator has had five straight red sessions.
BTC/USD hourly chart
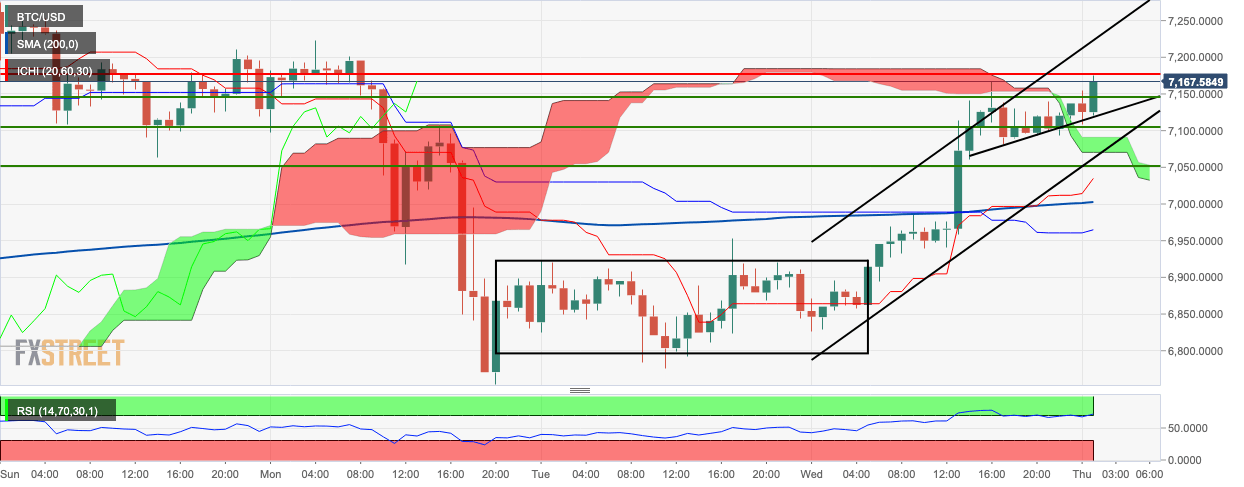
The hourly chart shows that the price has steadily risen over this Wednesday and Thursday, rising above the green Ichimoku cloud and the pennant structure. The bulls are next aiming for the $7,177.20 resistance line. The RSI indicator is crawling along the edge of the overbought zone.
Key levels
Author

Rajarshi Mitra
Independent Analyst
Rajarshi entered the blockchain space in 2016. He is a blockchain researcher who has worked for Blockgeeks and has done research work for several ICOs. He gets regularly invited to give talks on the blockchain technology and cryptocurrencies.


