Bitcoin Price Analysis: BTC/USD bearish flag pattern eyed subject to potential breakout south
- Bitcoin price on Tuesday is nursing losses of some 1.7% late in the session.
- BTC/USD price action via the 4-hour chart view is moving within a bearish flag formation.

Bitcoin price in the latter stages of trading on Tuesday is moving within negative territory, down some 1.7%. It has been an entirely slow session for the cryptocurrency market, as many of the major altcoins continue to move within consolidation mode.
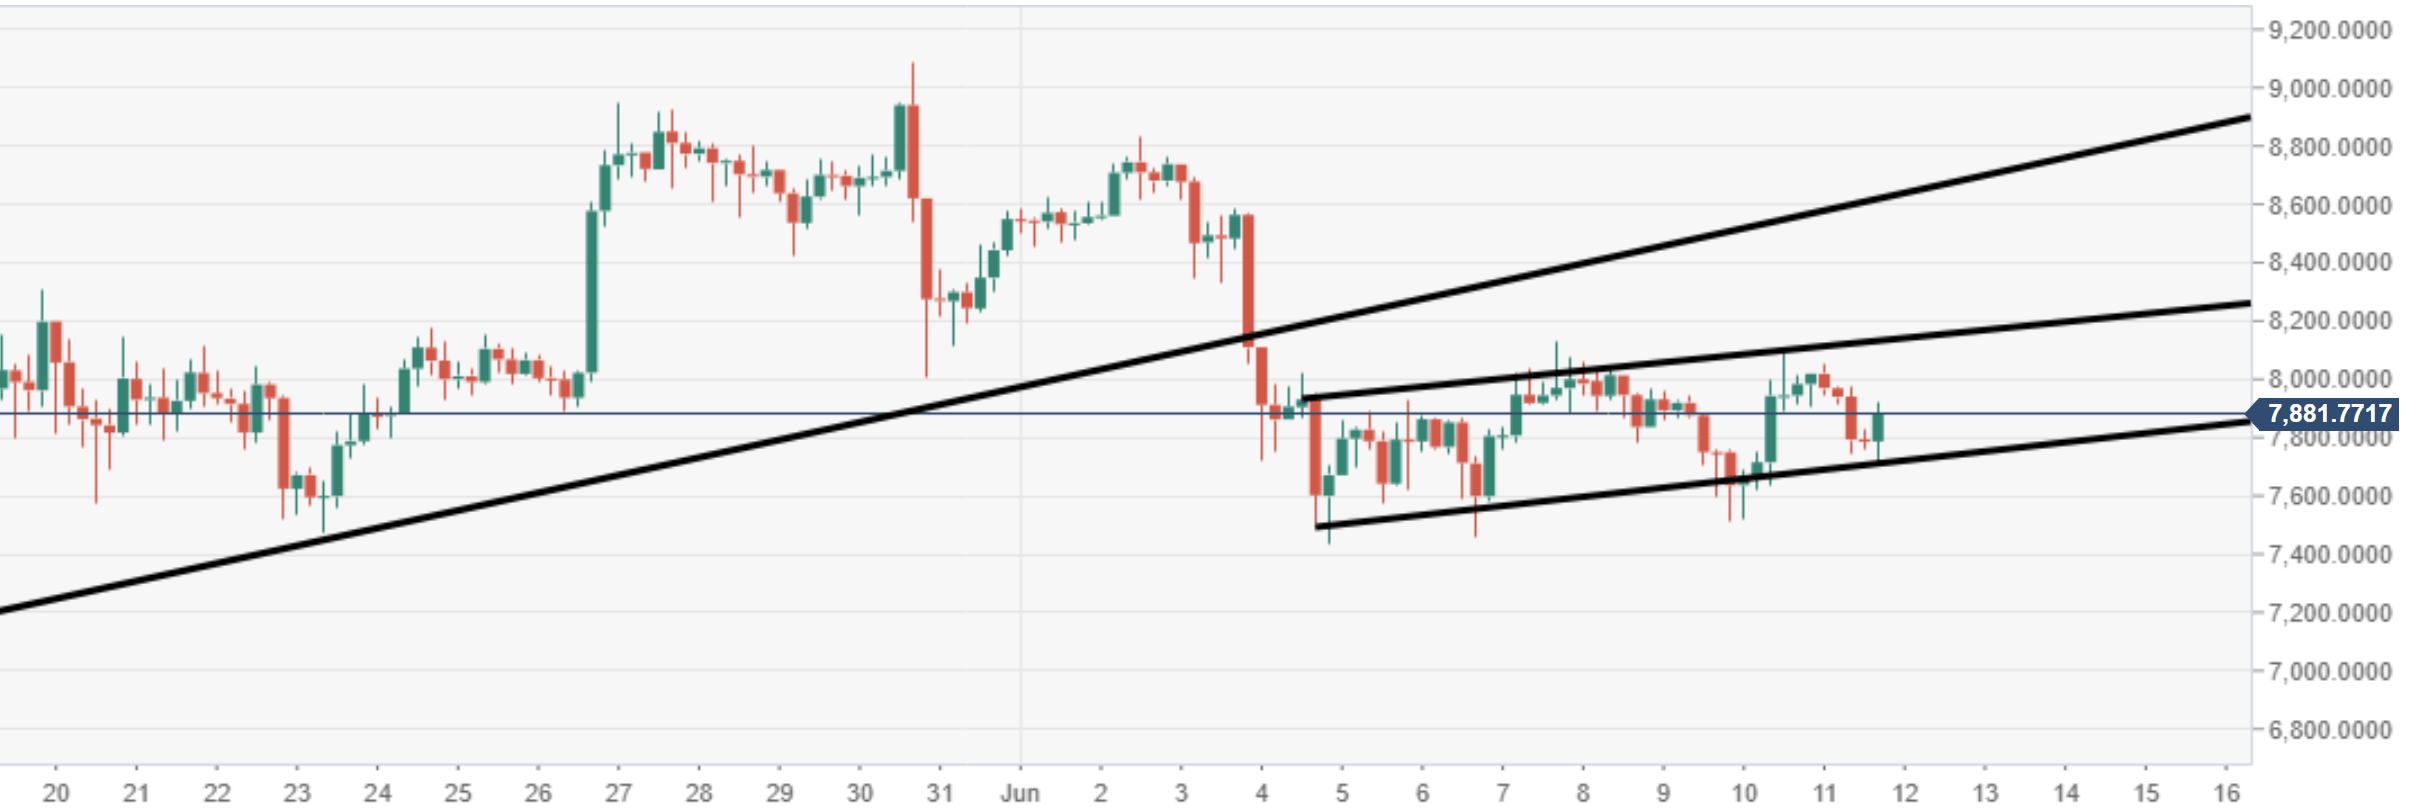
BTC/USD price action via the 4-hour chart view is moving within a bearish flag pattern formation. Given current price behaviour, Bitcoin does remain vulnerable to further downside pressure. Should a breach of the noted structure give way to the bears, a fresh wave of selling may be seen.
Technically, in term of the key levels to note; the downside, $7700, which is the lower acting trend line of the flag. Eyes will then be $7500, if this is broken then a fast return to $7000 could quickly be seen. To the upside; the trend line above is tracking at $8150, further north then $8400-500 range.
BTC/USD 4-hour chart
Author

Ken Chigbo
Independent Analyst
Ken has over 8 years exposure to the financial markets. He started his career as an analyst, covering a variety of asset classes; forex, fixed income, commodities and equities.


