Bitcoin Price Analysis: Bears eye $6775 amid symmetrical triangle breakdown
- BTC/USD breaks the three-day consolidation to the downside.
- BTC bears target a break below 6800 amid bearish technical view.
- A move above 7K needed for a sustained pullback.

Bitcoin (BTC/USD), the world’s largest cryptocurrency, is consolidating the latest sell-off to the lowest level in four days reached in the last hour at 6,876.90. The sellers returned with pomp and show amid Good Friday induced thin trading, as the No. 1 coin broke the three-day consolidative phase to the downside, representing a corrective move from monthly tops of 7,468.81. At the press time, Bitcoin is attempting a recovering from daily lows near 6,930 region, still sheds 5% on a daily basis. Its market capitalization stands at $127.06 billion.
Technical Overview
BTC/USD 1-hour chart
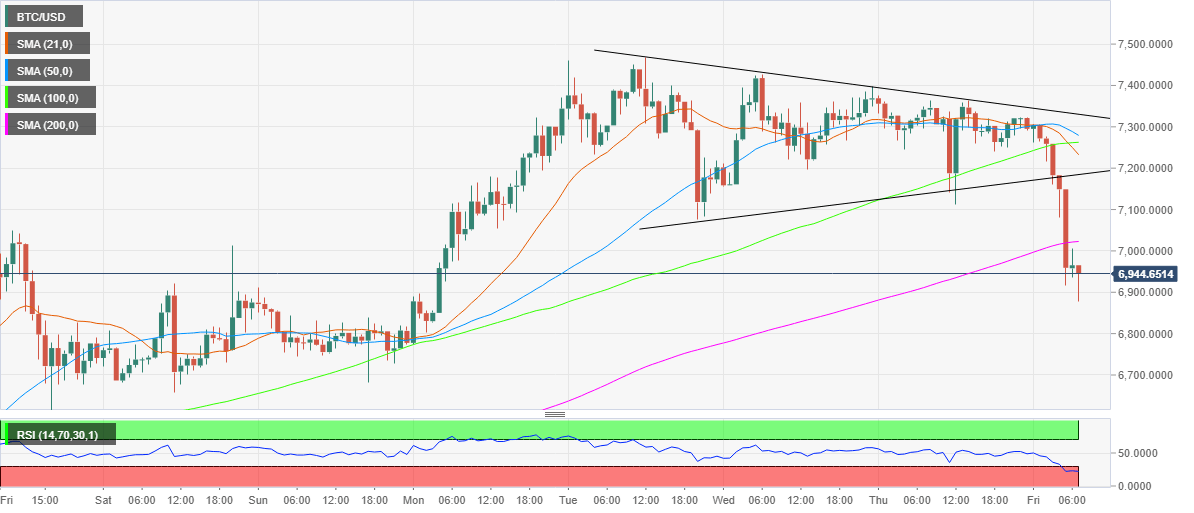
Technically, as observed on the hourly chart, the coin charted a symmetrical triangle breakdown in late Asia, following a breach of the triangle trendline support near 7,170 region. Subsequently, the selling interest intensified and knocked-off the price below the key support around the 7,000 level, the confluence of the psychological level and upward sloping 200-hourly Simple Moving Average (HMA).
The bearish bias was also reflected by the hourly Relative Strength Index (RSI) diving into the oversold territory. The RSI still has further room southwards before bottoming out and therefore, suggests the extension of the downside towards 6,775, the pattern target.
However, the most favorite coin could bounce back towards the previous key support-now-turned resistance around 7,000 before resuming the decline. Only a sustained breakthrough the latter could see the recovery momentum gaining traction for a test of the pattern’s ascending trendline resistance, now located at 7,185.
All in all, the risks remain skewed to the downside in the near-term, should markets respect the bearish break.
BTC/USD technical levels to watch
Author

Dhwani Mehta
FXStreet
Residing in Mumbai (India), Dhwani is a Senior Analyst and Manager of the Asian session at FXStreet. She has over 10 years of experience in analyzing and covering the global financial markets, with specialization in Forex and commodities markets.


