Bitcoin: One more shakeout before new all-time highs?

In our previous update, we made three important long- and short-term observations about Bitcoin (BTC)
1) 2025 was a bad year for Bitcoin, as it ended lower. However, despite limited data, BTC has never closed lower for two consecutive years. Since 2024 was a green year, we should expect 2026 through possibly 2028 to be green.
2) However, at this stage, as in 2015 and as discussed previously, we can’t rule out a lower low near the upper end of long-term support ($69-73K) this year before Bitcoin really takes off.
3) It needs to break above the December 9 at $94617. We can then begin looking for [a potential 3rd wave]. The Bulls’ warning levels are therefore now adjusted to 91483, 90327, 88410, 86704, and 84424. Each successive break below these levels increases the probability by 20% that BTC will reach the low to mid $70Ks before attempting another rally.
These observations are important because they set the framework for what is happening now and what is likely to happen. Fast forward to today. BTC broke out above the $94,617 level on January 13, but it held above it for only four days, and it is now at ~$88,000. It was a fake breakout, invalidating the possible impulse path we were tracking. Meanwhile, the 3rd warning level has been broken, giving it a 60% chance that the uptrend is over. Hence, we have switched our alternative, bearish Elliott Wave Principle (EW) count to the primary expectation. See Figure 1 below.
Figure 1. Bitcoin’s intermediate-term Elliott Wave count since June 2025
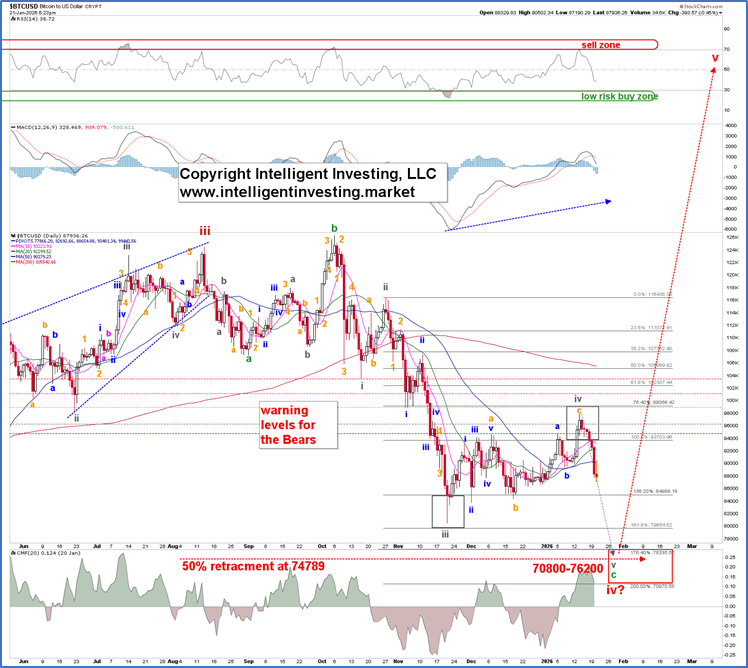
The false breakout strongly suggests the January 14 high at $97,943 was the top of the orange Wave-c of the gray W-iv. In this case, the W-c was about the same length as the same-degree, orange, W-a that ended at $94617: 13519 vs 14055. Classic.
Typically, the 3rd wave extends to the 138.2-161.8% extension of the 1st wave, measured from the 2nd wave. On November 21, the low at $80,562 was almost the 1.618x extension of the gray W-i low on October 17, measured from the gray W-ii high on October 27 at $79,654. After W-iii, W-iv and W-v will follow. The former tends to target the 76.4-100% extension zone, whereas the latter then targets the 176.4-200.0% extension zone.
The January 14 gray W-iv high was almost at the 76.4% level: $97,943 vs. $99,068. Thus far, so good: Bitcoin’s price action appears to follow an impulse pattern to the downside. Additionally, W-ii was a zigzag, and W-iv was an expanded flat, satisfying the rule of alternation. As such, contingent on Bitcoin holding below the January 14 high at $97,943, we expect it to reach the 176.4-200.0% Fibonacci-extension zone at $76335-70970 for the gray W-v, satisfying items 2) and 3) from the list above.
That should then conclude a larger irregular expanded flat, red W-iv, comprising green W-a, -b, and -c, which in turn form a 3-3-5 pattern (gray a, b, c - a, b, c - i, ii, iii, iv, v) right around the 50% retracement of the entire red W-iii. From there, red W-v can start at least to $164K, satisfying item 1) of the list above.
Author

Dr. Arnout Ter Schure
Intelligent Investing, LLC
After having worked for over ten years within the field of energy and the environment, Dr.


