Bitcoin Gold Price Analysis: BTG/USD bulls remain in control, price hovers above the 20-day Bollinger Band
- BTG/USD trends in an upwards channel formation.
- Moving Average Convergence/Divergence (MACD) indicates increasing bullish momentum.

BTG/USD daily chart
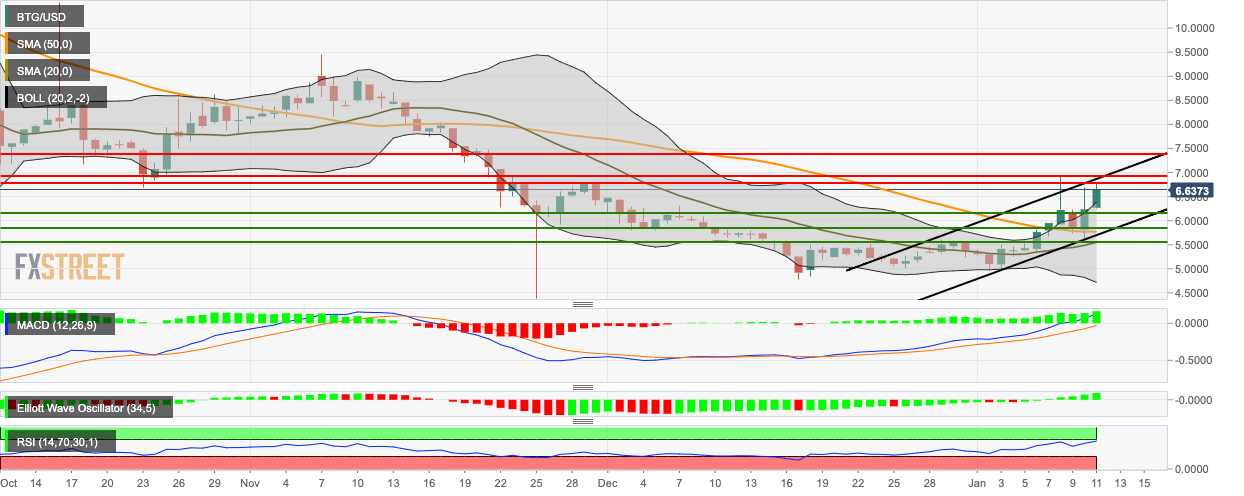
BTG/USD is currently trending in an upward channel formation and is on course of charting a second consecutive bullish session. This Friday, BTG/USD went up from $5.80 to $6.25 and has gone up further to $6.65. BTG/USD is hovering above the 20-day Simple Moving Average (SMA 20) and SMA 50 curves. The price also happens to be trending above the 20-day Bollinger Band, hinting that BTG/USD is overpriced and may face bearish correction. The Moving Average Convergence/Divergence and Elliott Oscillator both show that the market sentiment is presently bullish. The Relative Strength Index (RSI) indicator is trending around 66.35, next to the overbought zone, hinting that the price may go up a bit more before facing a bearish correction.
Author

Rajarshi Mitra
Independent Analyst
Rajarshi entered the blockchain space in 2016. He is a blockchain researcher who has worked for Blockgeeks and has done research work for several ICOs. He gets regularly invited to give talks on the blockchain technology and cryptocurrencies.


