Bitcoin (BTC/USD) buying the dips after Elliott Wave double three

Hello fellow traders. In this technical article we’re going to take a look at the Elliott Wave charts charts of Bitcoin BTCUSD published in members area of the website. Our members are aware of the numerous positive trading setups we’ve had in the crypto market recently. One of them is BTCUSD, which experienced a pullback, unfolding as an Elliott Wave Double Three Pattern. It completed clear 7 swings from the peak on March 14th and concluded the correction right at the Equal Legs zone (Blue Box Area). In the following text, we’ll delve into the Elliott Wave pattern and trading setup.
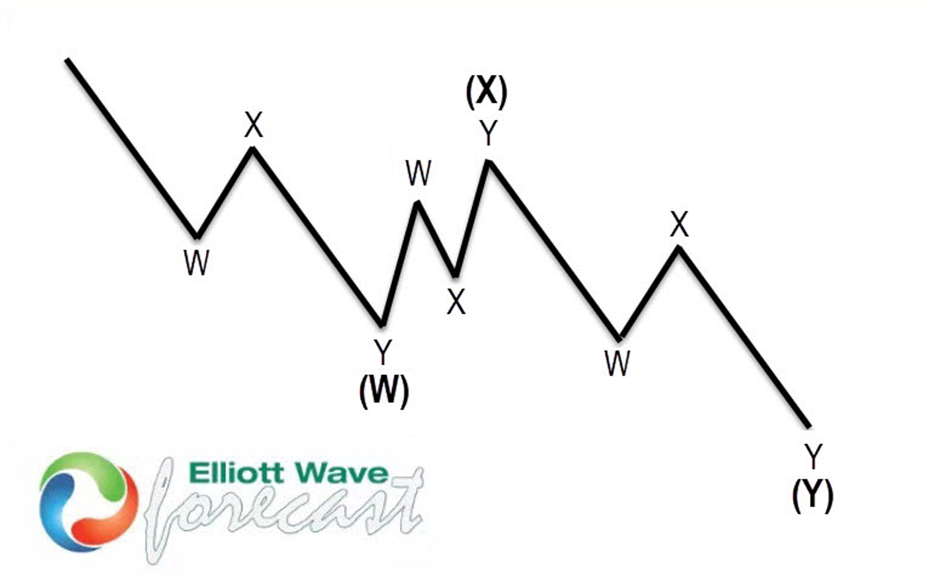
Before we take a look at the real market example, let’s explain Elliott Wave Double Three pattern.
Elliott Wave Double Three Pattern
Double three is the common pattern in the market , also known as 7 swing structure. It’s a reliable pattern which is giving us good trading entries with clearly defined invalidation levels.
The picture below presents what Elliott Wave Double Three pattern looks like. It has (W),(X),(Y) labeling and 3,3,3 inner structure, which means all of these 3 legs are corrective sequences. Each (W) and (Y) are made of 3 swings , they’re having A,B,C structure in lower degree, or alternatively they can have W,X,Y labeling.
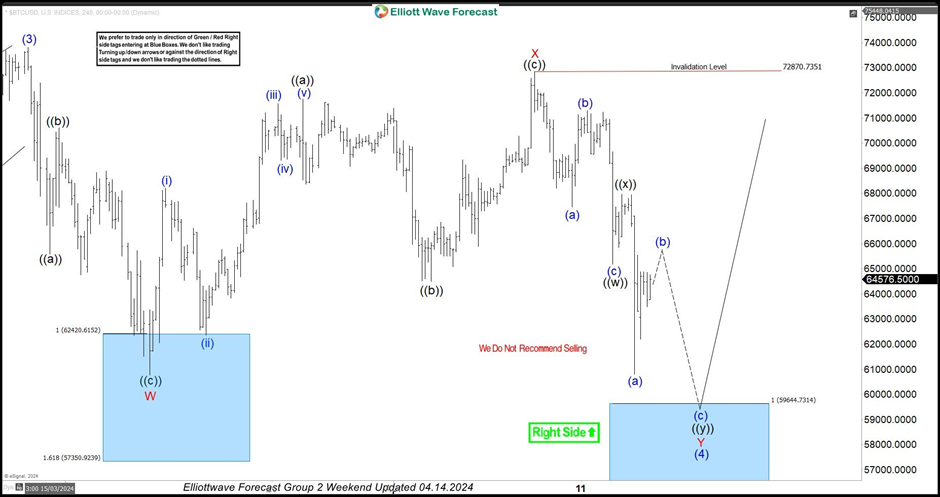
BTCUSD H4 weekend update 04.14.2024
BTCUSD is currently d0ing a wave (4) correction, unfolding in a 7-swing pattern. The pullback is identified with WXY red labeling. The first leg, W red, exhibits a clear 3-wave structure ((a))((b))(c)) black, followed by a 3-wave bounce in X red. Consequently, we anticipate the pullback to evolve as a Double Three pattern, indicating a projection of 3 waves in Y red as well. As of now, the structure remains incomplete. BTCUSD should ideally see another leg down toward the buying zone: 59644.73 to 56551.93. We expect the crypto to rally from there toward new highs or alternatively in a 3-wave bounce. Once the price retraces to the 50% Fibonacci level against the X red connector, we’ll secure positions, set the stop loss at breakeven, and take partial profits.
Official trading strategy on How to trade 3, 7, or 11 swing and equal leg is explained in details in Educational Video.
Quick reminder on how to trade our charts :
Red bearish stamp+ blue box = Selling Setup
Green bullish stamp+ blue box = Buying Setup
Charts with Black stamps are not tradable.
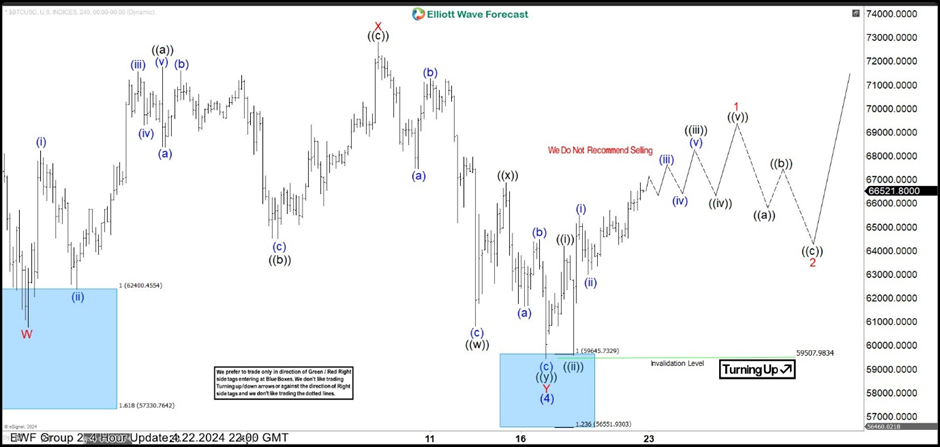
BTCUSD H4 update 04.21.2024
Bitcoin found buyers as expected. It made decent rally from the Blue Box. Bounce already reached 50 fibs against the X red connector which confirms cycle from the peak is done. Consequently, any long positions from the equal legs area are risk free by now and we have taken partial profits. We call wave (4) completed at the 59507.9 low.
Keep in mind not every chart is trading recommendation.
Author

Elliott Wave Forecast Team
ElliottWave-Forecast.com


