Binance Coin Technical Analysis: BNB/USD at risk of losing $15 after an extended bear market
- BNB/USD is losing ground to Bitcoin and it’s at risk of falling below $15.
- BNB lost the daily uptrend weeks ago and hasn’t been able to recover.
It wasn’t long ago that BNB was outperforming the entire crypto market. Every Binance announcement pumped BNB by 5-10%. Unfortunately, BNB couldn’t keep up and eventually had a massive crash. Binance coin is currently far weaker than the rest of the market, for instance, the daily uptrend has been lost since June 11 while Bitcoin and others managed to regain it on June 22.
BNB/USD daily chart
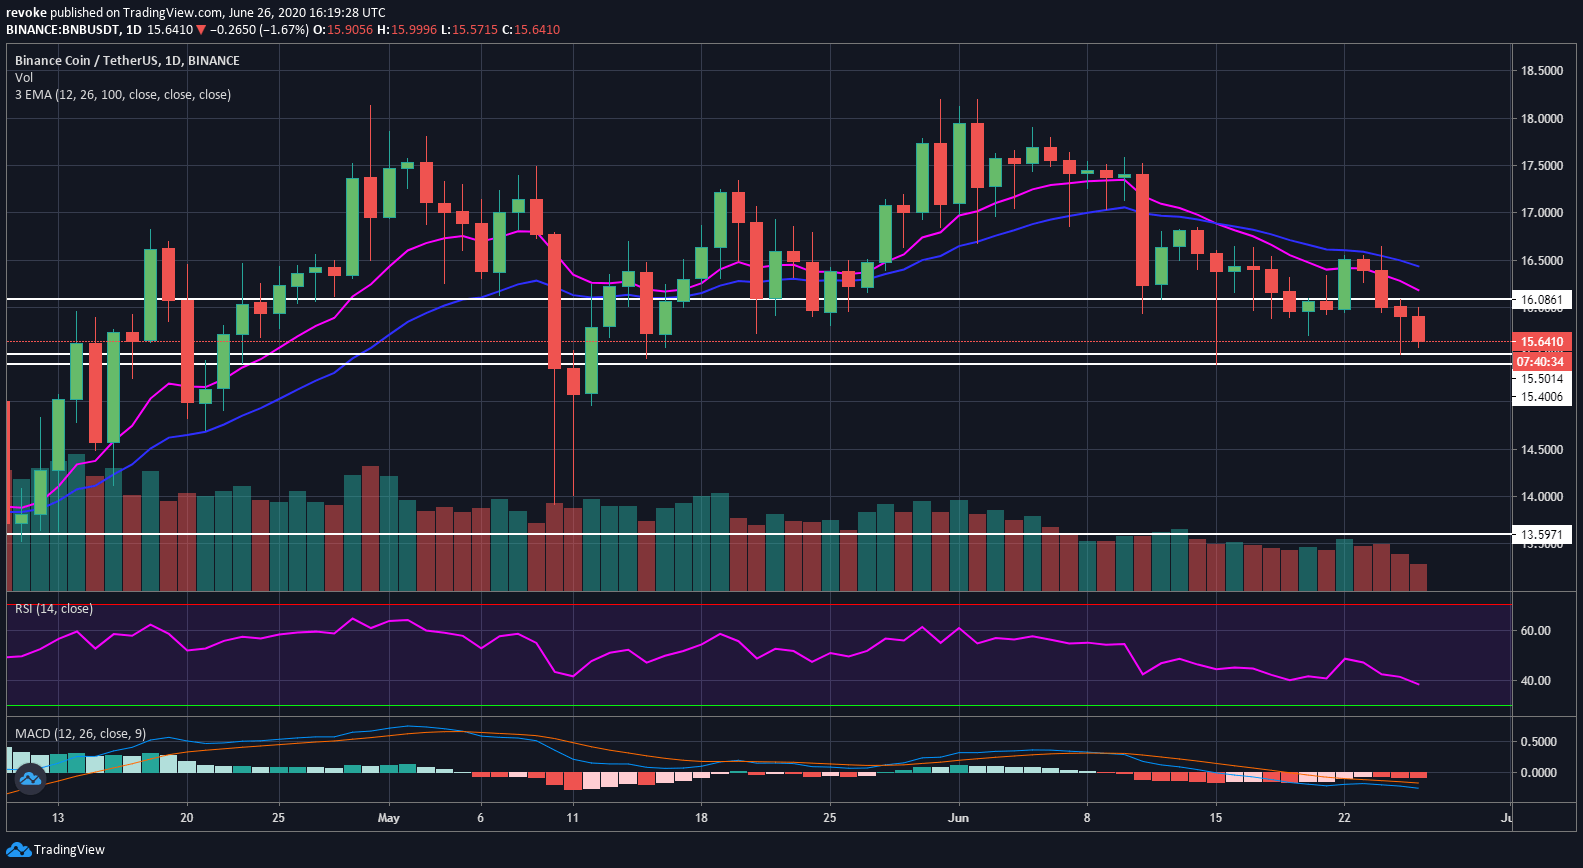
Not many positive indicators for BNB here, the 12-EMA and the 26-EMA crossed bearishly on June 15, a bit after the MACD had a bear cross. The daily RSI is at 38 points but not yet oversold which means bears can see even more selling. The trading volume has been decreasing significantly this month.
BNB/USD 4-hour chart
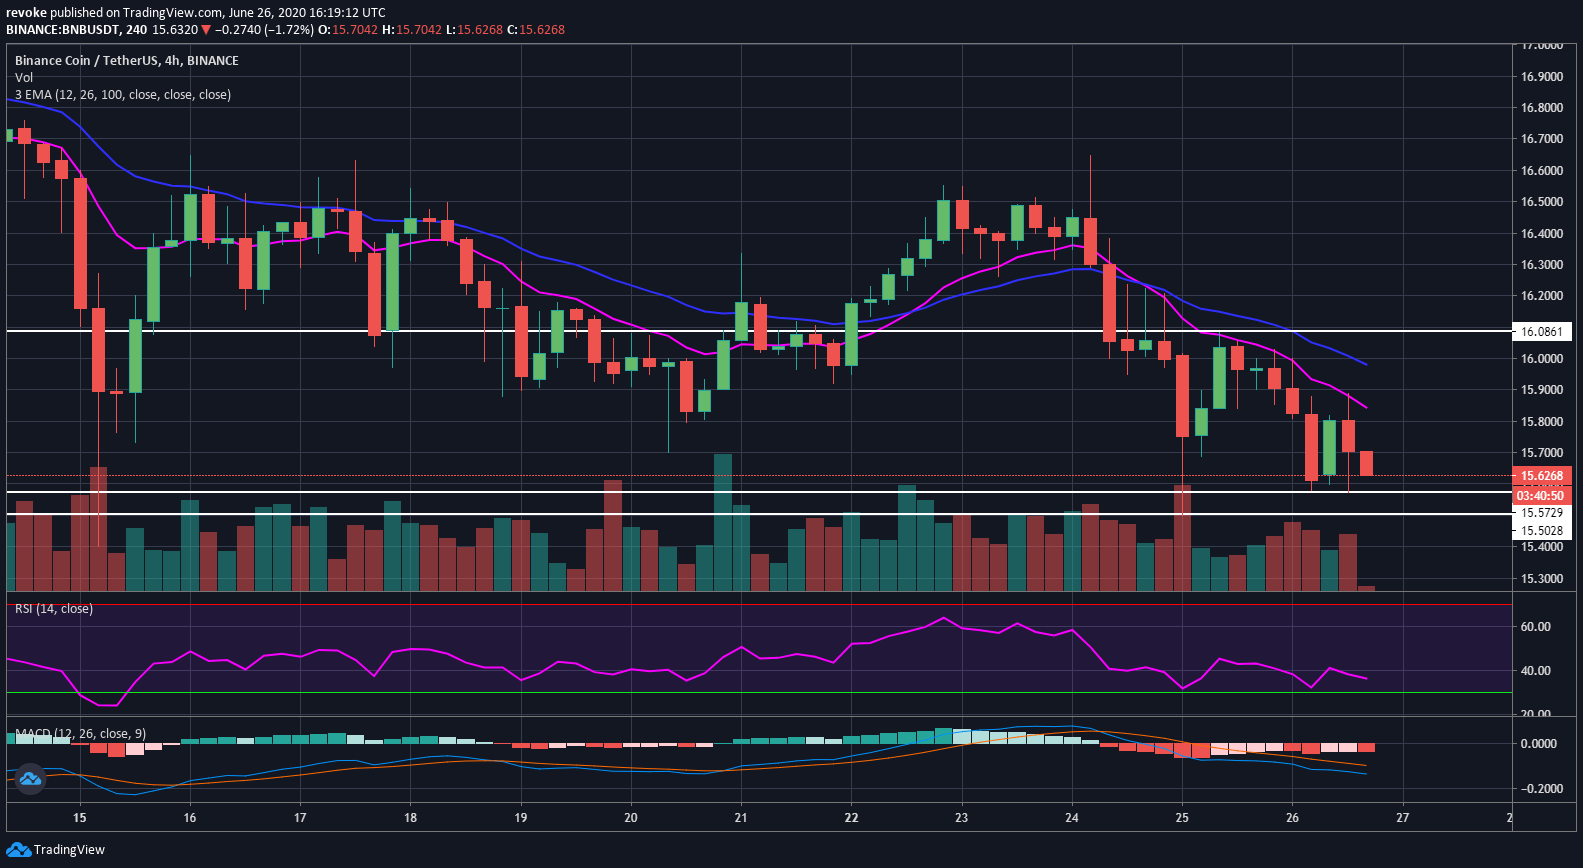
The 4-hour chart is also in a downtrend but a higher low has been formed at $15.57 which means buyers could change the trend in the near future if they have enough strength. The next resistance level to beat is $15.84, the 12-EMA followed by $15.98, the 26-EMA. The last resistance level is established at $16.08 which is the 4-hour-high.
Author

Lorenzo Stroe
Independent Analyst
Lorenzo is an experienced Technical Analyst and Content Writer who has been working in the cryptocurrency industry since 2012. He also has a passion for trading.


