|

BCH/USD technical analysis: Bitcoin Cash has come back to test the consolidation area

  • Bitcoin Cash is trading 0.40% higher today even as BTC/USD struggles.
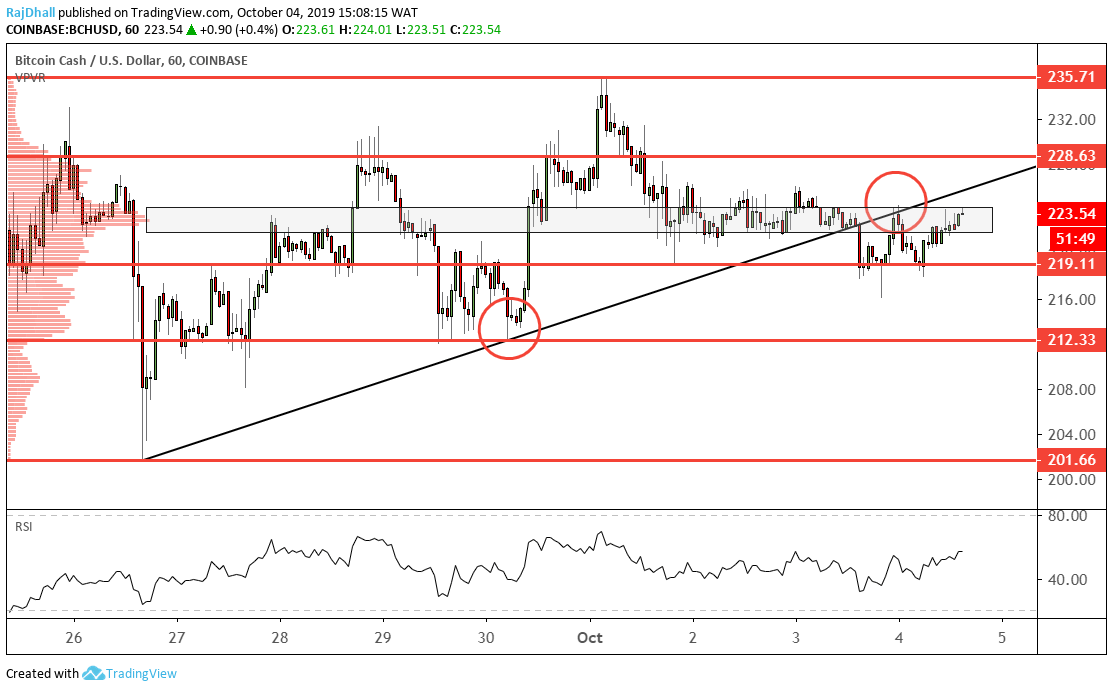
  • The price broke a key trendline yesterday on the hourly chart and has now come back to test it.

The BCH/USD price has come back to the hourly pivot zone of around 223.50 as traders struggle to identify any real direction.

There was a bearish trendline break yesterday on the hourly chart but price has come back to retest the diagonal line for the second time.

The blue rectangle in the middle of the chart represents the value area formed as most volume has been traded at this price area.

If the price breaks 226.00 to the upside it could indicate that the short term trend has broken higher again. 

The relative strength index (RSI) indicator has moved back over the 50 mid-line again but it has been in limbo for quite some time now as volatility seems to have dropped.

Look out for the retest of the trendline once again and then we could have a better idea of where price may be heading.

Bitcoin cash analysis

BCH/USD

Overview
Today last price223.4977
Today Daily Change0.9078
Today Daily Change %0.41
Today daily open222.5899
 
Trends
Daily SMA20267.9223
Daily SMA50288.0459
Daily SMA100318.7184
Daily SMA200321.1382
 
Levels
Previous Daily High225.9256
Previous Daily Low216.1419
Previous Weekly High311.7574
Previous Weekly Low202.6094
Previous Monthly High333.7339
Previous Monthly Low202.6094
Daily Fibonacci 38.2%219.8793
Daily Fibonacci 61.8%222.1882
Daily Pivot Point S1217.1793
Daily Pivot Point S2211.7688
Daily Pivot Point S3207.3957
Daily Pivot Point R1226.963
Daily Pivot Point R2231.3361
Daily Pivot Point R3 236.7467

Author

Rajan Dhall, MSTA

Rajan Dhall is an experienced market analyst, who has been trading professionally since 2007 managing various funds producing exceptional returns.

More from Rajan Dhall, MSTA
Share:

Editor's Picks

Aave Price Forecast: AAVE surges as capital flows return to DeFi
Aave (AAVE) extends its rally, trading above $81 on Thursday after closing above its key resistance and surging more than 10% the previous day. The bullish move is supported by improving on-chain metrics, with USDT deposits flowing back into the protocol and strengthening its lending ecosystem.
Crypto Market Overview: Bitcoin tests $60,000 as whales sell off – Aave and Jupiter show resilience

The broader cryptocurrency market remains under intense selling pressure, with Bitcoin back at $60,000 for the third time this year. On-chain data shows selling pressure from large-wallet investors, commonly referred to as whales, while total liquidations hit nearly $1 billion in 24 hours.

XRP Price Forecast: Ripple and SBI Group partner to launch RLUSD in Japan

Ripple remains under pressure, trading at $1.06 after losing nearly 5% so far this week. Ripple and SBI Group partnered to launch RLUSD stablecoin in Japan following approval from the Japan Financial Services Agency on Thursday, but the move failed to lift sentiment.

Ethereum Price Forecast: ETH could see a 30% decline if history repeats​
Ethereum (ETH) has fallen toward the $1,600 level, down over 3% on Wednesday as risk-off signs persist across key onchain metrics. The ETH Realized Price Lower Band, which has historically marked bear market bottoms for the top altcoin, suggests ETH has room for further downside before staging a proper upward move.
Bitcoin: Recovery hopes fade after the Fed spoils the party
Bitcoin (BTC) is set to end the week in the red, trading near the 200-Week Simple Moving Average (SMA) at around $62,300 on Friday. Institutional selling persists, capping BTC’s recovery as spot Exchange Traded Funds (ETFs) point to a sixth consecutive week of outflows.