Band Protocol Price Prediction: BAND whales go on a buying frenzy while technicals suggest sell-off is coming
- Band Protocol price is up by 40% in the past 24 hours reaching $17.38.
- Despite the significant increase in value, whales have continued to accumulate a lot of BAND tokens.
- A crucial indicator shows that Band Protocol is on the verge of a short-term sell-off.

Band Protocol has just topped out at $17.38, creating a potential triple top as the digital asset hit $17.78 in August 2020 and $17 in September 2020 and then plummeted. Nonetheless, BAND whales went on a buying frenzy and are pushing the digital asset higher, perhaps with enough strength to break the all-time highs.
Band Protocol shows mixed signals while whales continue to accumulate
According to statistics provided by Santiment, the number of whales holding between 10,000 and 100,000 BAND tokens ($170,000 and $1,700,000) has spiked by 18 since January 25 despite the Band Protocol price rising.
%20[20.47.44,%2011%20Feb,%202021]-637486700373479467.png)
BAND Holders Distribution chart
This indicates that BAND has a lot of strength right now. On the daily chart, an ascending triangle pattern seems to have formed since July 2020 with a key resistance level at around $17. A clear breakout above this point would quickly push Band Protocol price towards a new all-time high at $31, an 83% move calculated by using the height of the pattern.
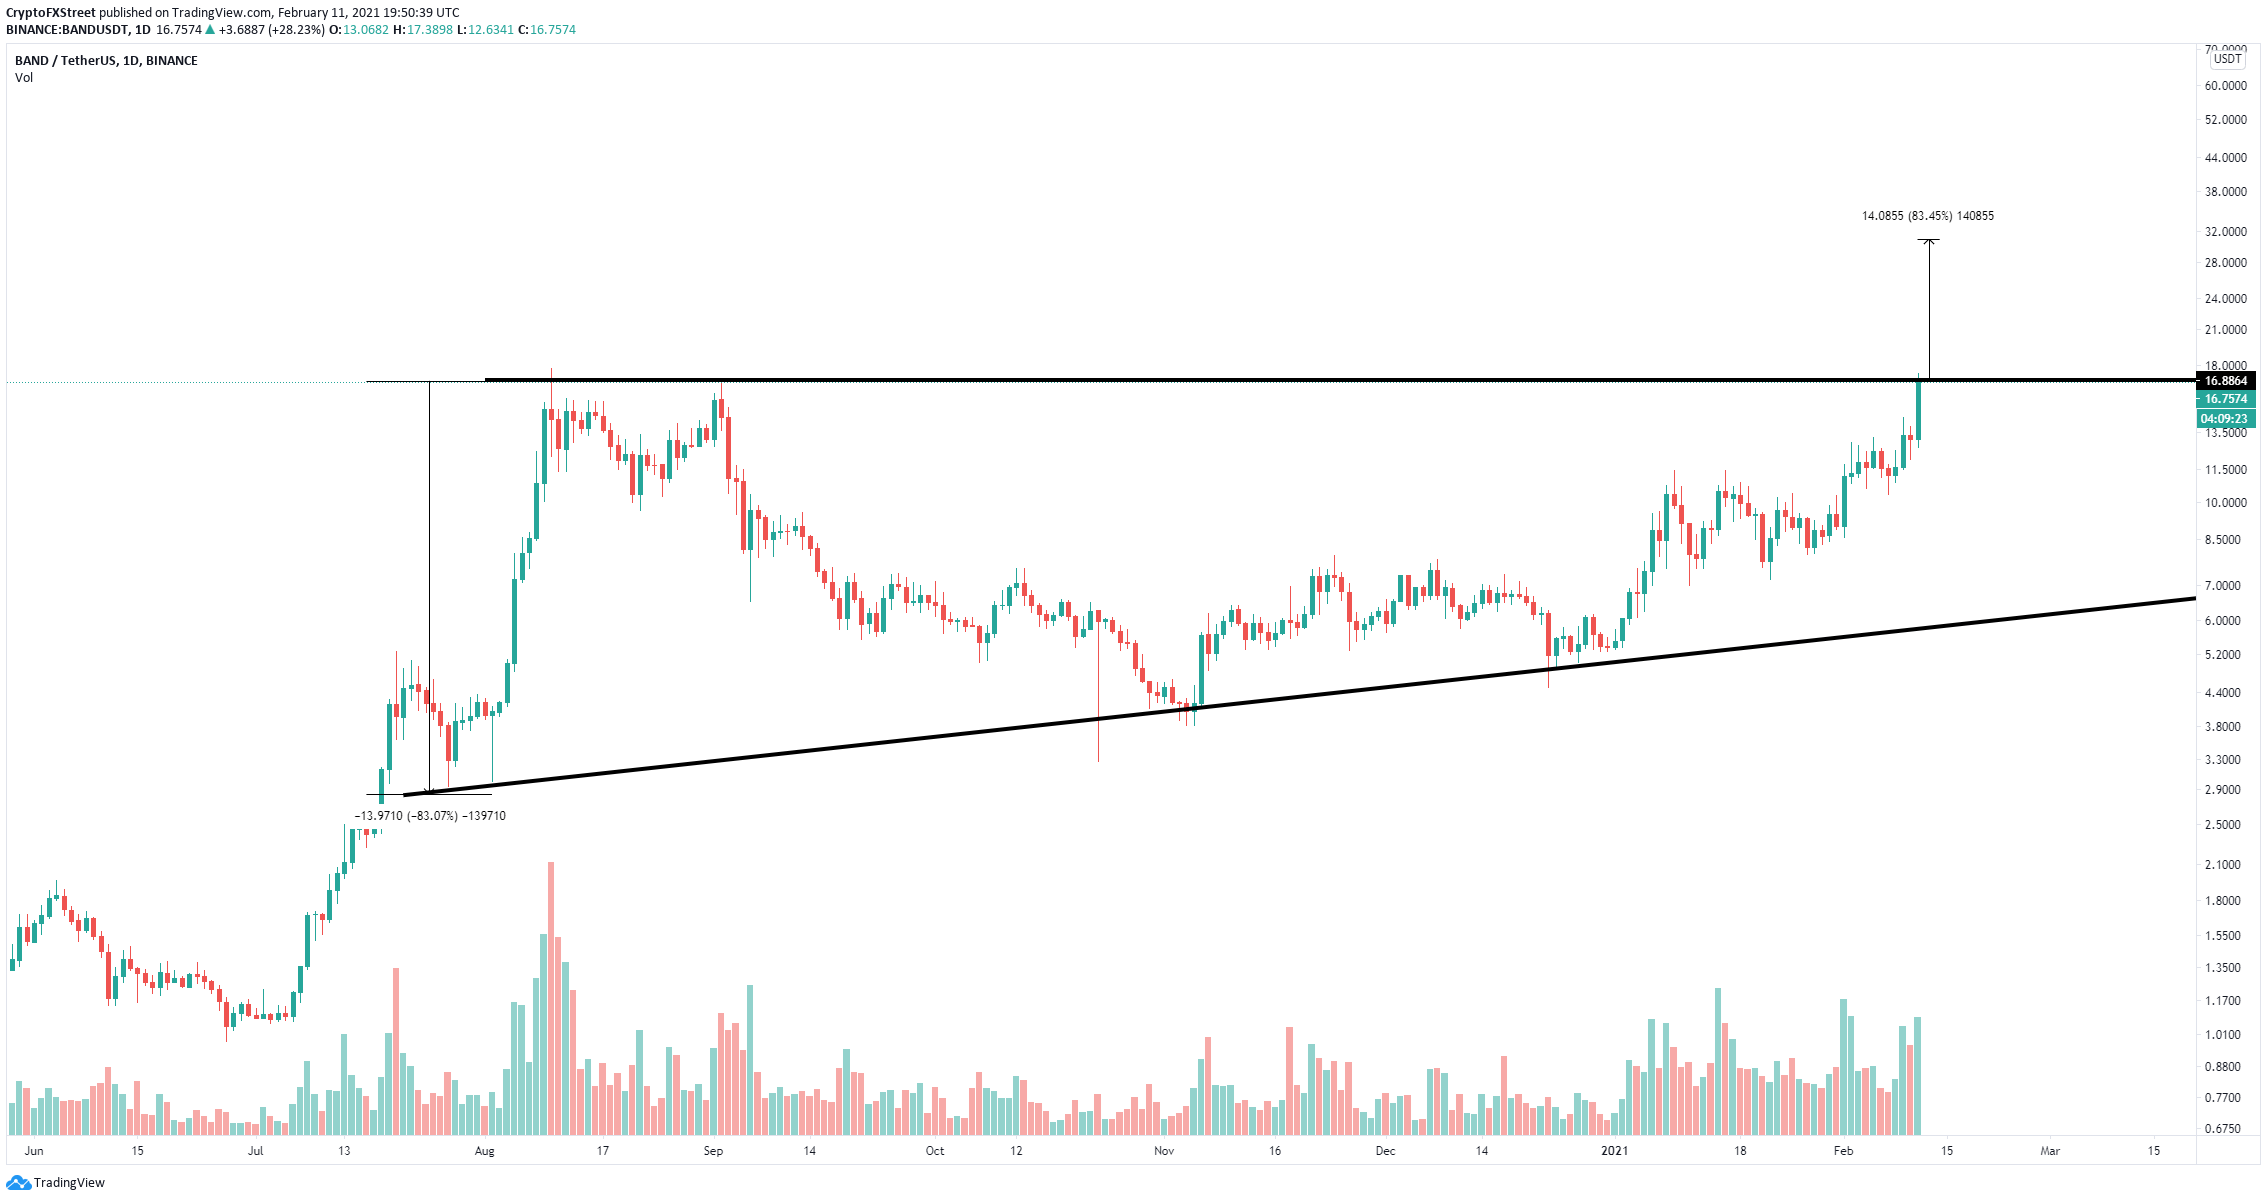
BAND/USD daily chart
On the other hand, the TD Sequential indicator has presented a sell signal on the 2-hour chart right at the key resistance level of $17. Additionally, on the 12-hour chart, the indicator has also printed a green ‘8’ candlestick.
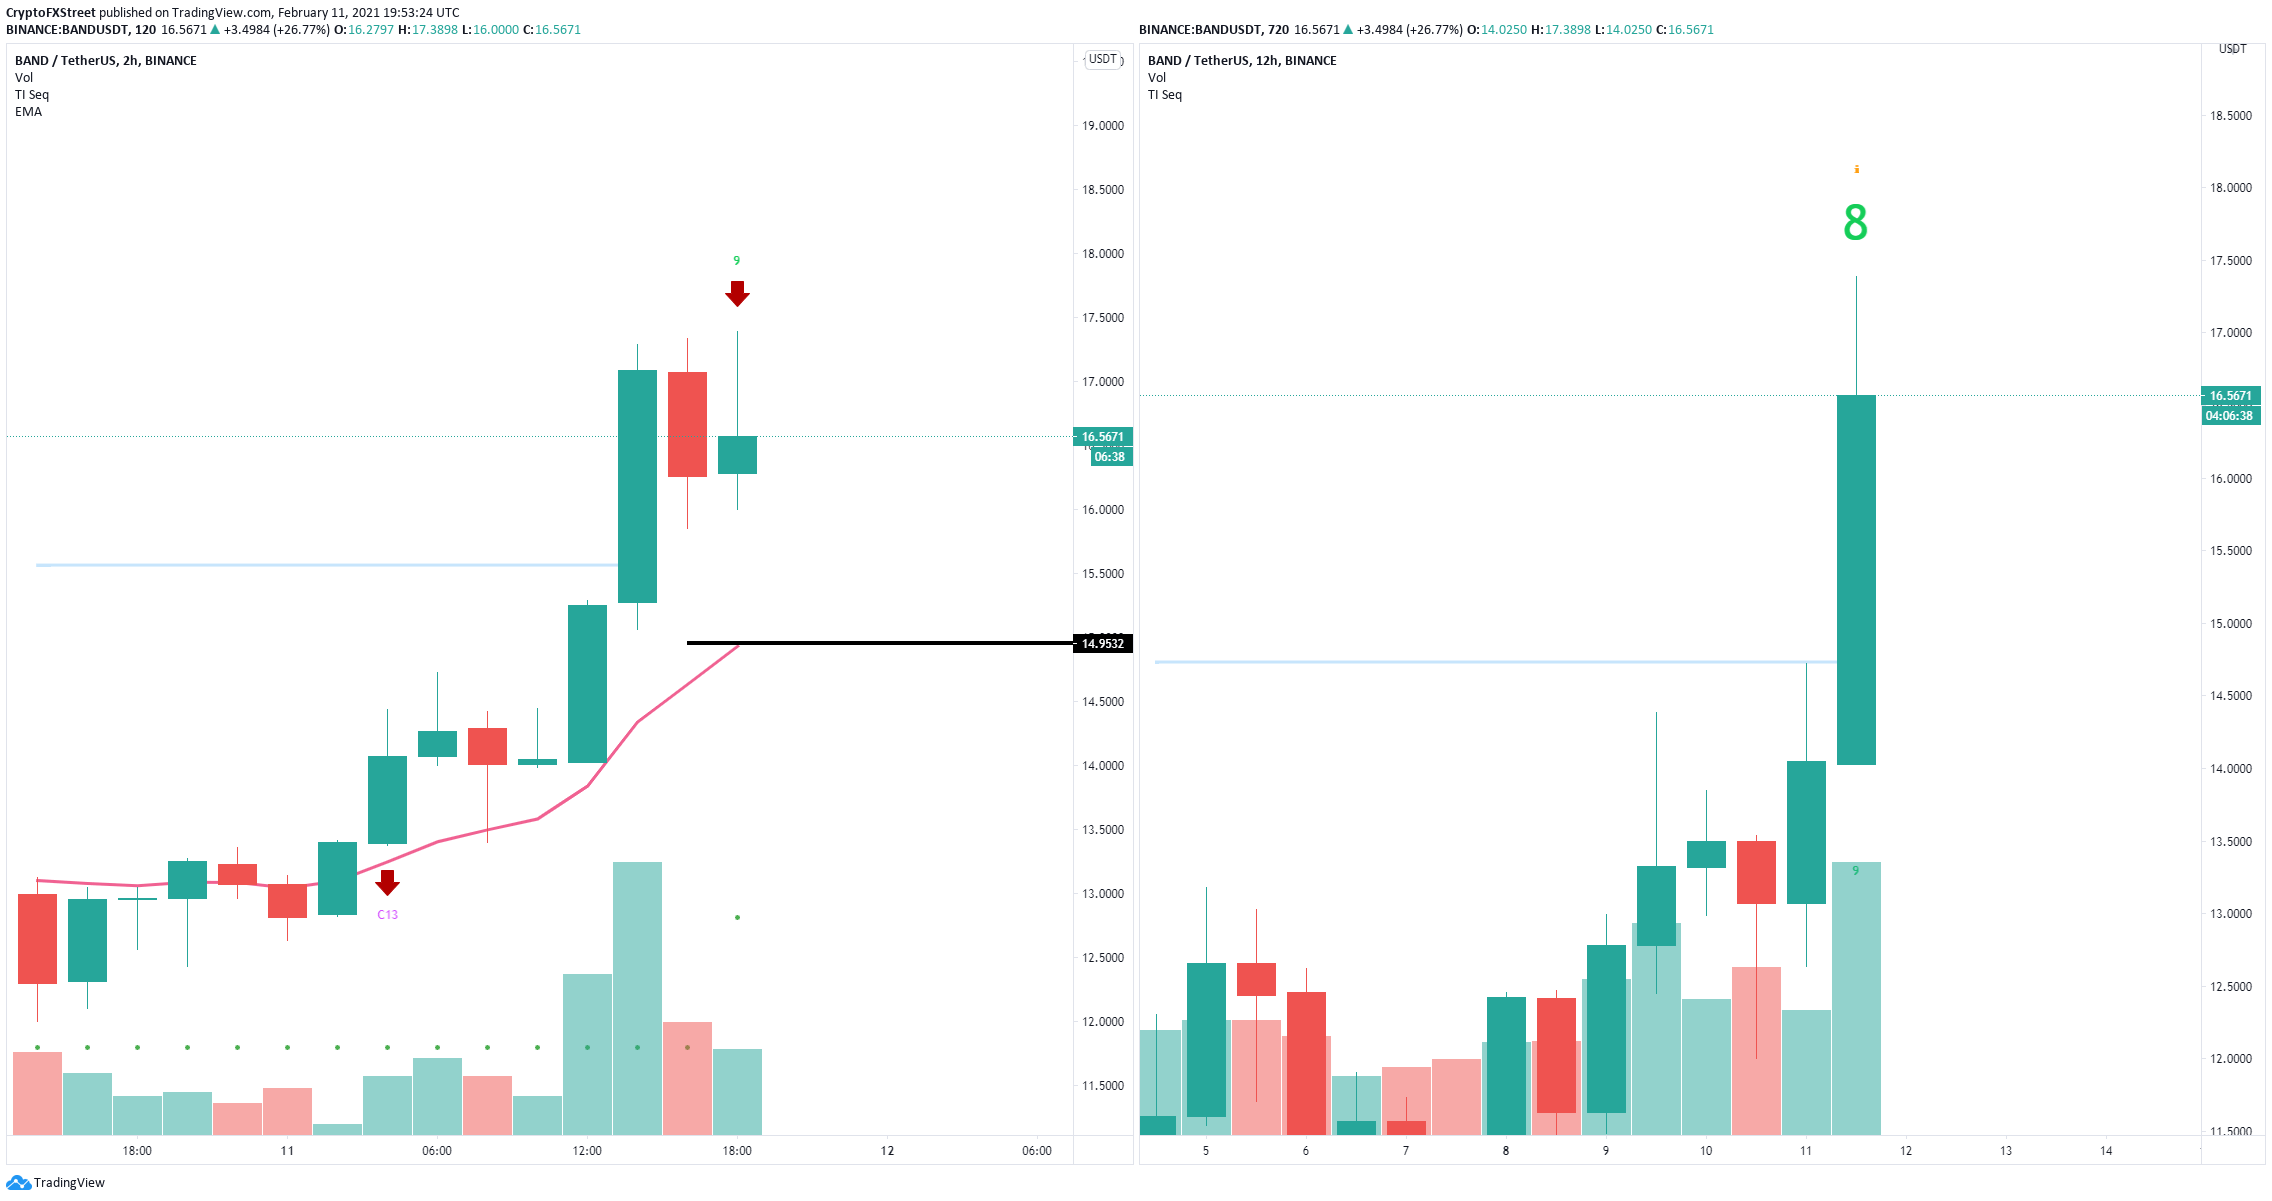
BAND sell signals
Usually, the green ‘8’ candlestick is followed by a sell signal. Considering that Band Protocol price faces a key resistance level at $17, the bearish outlook has a lot of credence. There is also very low support on the way down and BAND can quickly fall towards $15.
Author

Lorenzo Stroe
Independent Analyst
Lorenzo is an experienced Technical Analyst and Content Writer who has been working in the cryptocurrency industry since 2012. He also has a passion for trading.



