Analytical overview of ZAP, XRP, and DOGE: Price correlation continues to offer long-term trade direction

The cryptocurrency market, except for a select few Altcoins, is witnessing a bout of profit-taking following the massive rallies in the prior week. While this may seem worrisome to new traders, it must be stated that corrections can be healthy for a particular market.
Dogecoin has staged impressive rallies in the past, however, these have been followed by a period of declines and consolidation – and the meme cryptocurrency’s price is currently significantly lower than what it was prior to Elon Musk’s SNL appearance over the weekend.
ZAP and Ripple’s XRP are two other Altcoins which are also attracting growing interest from investors.
ZAP Technical Analysis: Amid Rebound, the Price Settles To Hold Steady in a Sideways Range
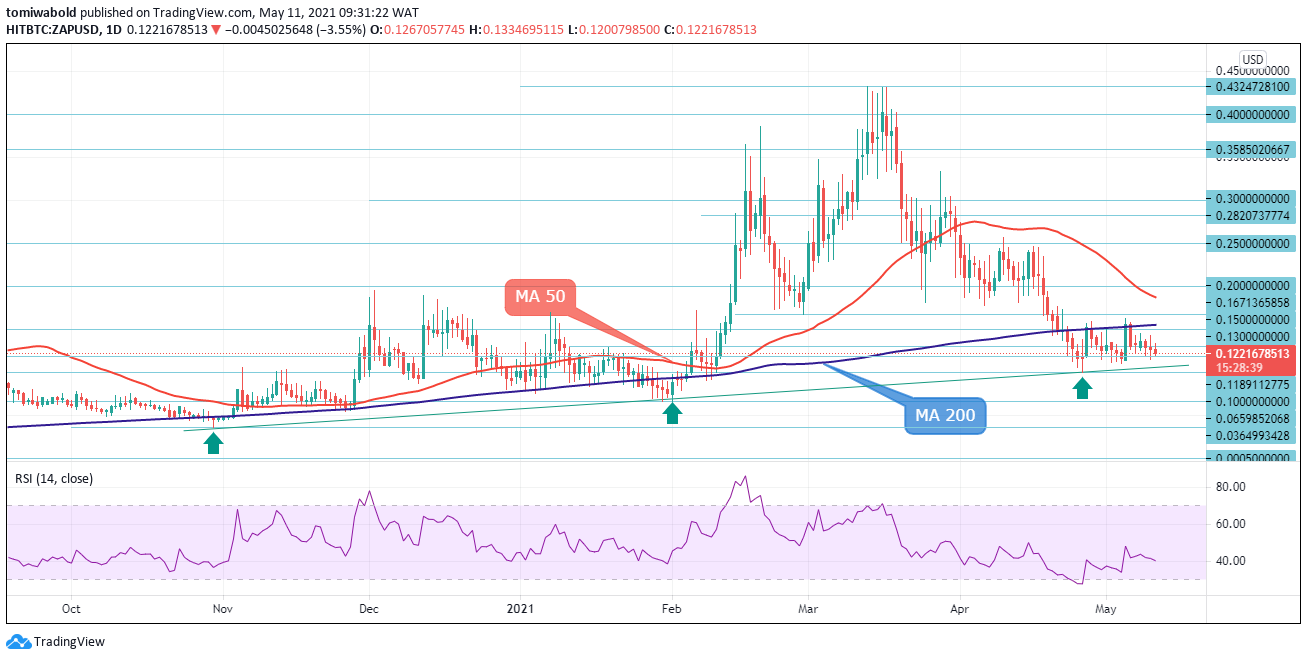
ZAP/USD Daily Chart
ZAP/USD continues to trade in a range for the second consecutive session in the week. As a result, price action is trading within a tight band of the $0.1147 and the $0.1427 levels in the near term. The relative strength index (RSI) remains biased toward sideways with limited downside potential. This could mean that if ZAP prices exceed the $0.15 level of resistance, then we can expect its gains to accelerate.
Price action, on the other hand, is unwavering, with the sideways range remaining steady for the time being. Since there isn't any more bearish momentum, this potential consolidation is likely to result in a quick retracement back to the upside. Failure of support near $0.11, on the other hand, could cause a fall. Only a good breakout above the $0.15 level on the upside would likely intensify any gains that could occur.
XRP Technical Analysis: Price Returns to Red After a Brief Recovery Attempt
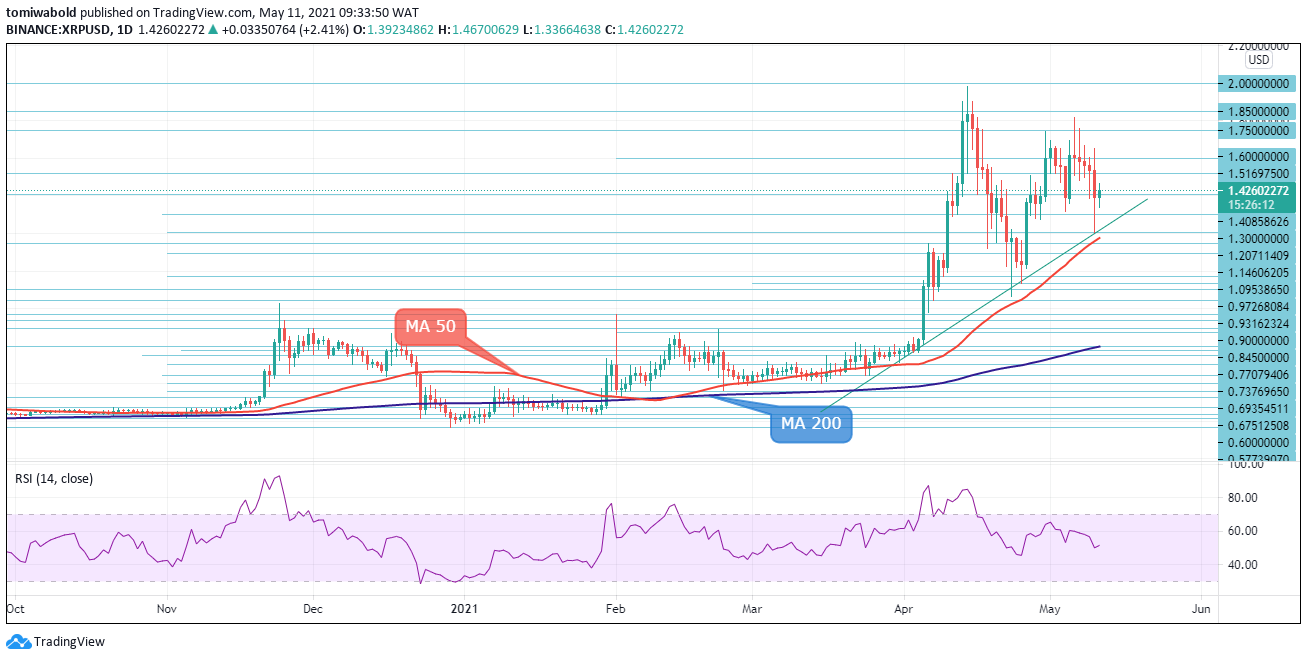
XRP/USD Daily Chart
The downward correction off the yearly high of $1.98 took a breather following a brief recovery attempt which stalled at $ 1.81 on May 6. Bearish risks continue to sponsor the downside as XRP price returns to trade in red, posting five days of consecutive declines to reach a three-week low of $1.20. That said, guarding the price action off the yearly low of $0.19 are the ascending trendline support at $1.20, the MA 50 ($1.15), and MA 200 ($0.59) which should offer support in case of extreme declines.
The RSI, though at mid-reading, appears to be preparing for a dive towards the bearish territory. XRP seems to have molded a stable descent from the $1.81 high, the resistance from this level may try to prevent price gains from evolving. Successfully conquering this barrier may encourage buyers to aim for the $2 and $3 levels. However, short-term momentum is currently frozen awaiting the next direction.
DOGE Technical Analysis: Negative Risks Still Alive After Short-Lived Record Highs
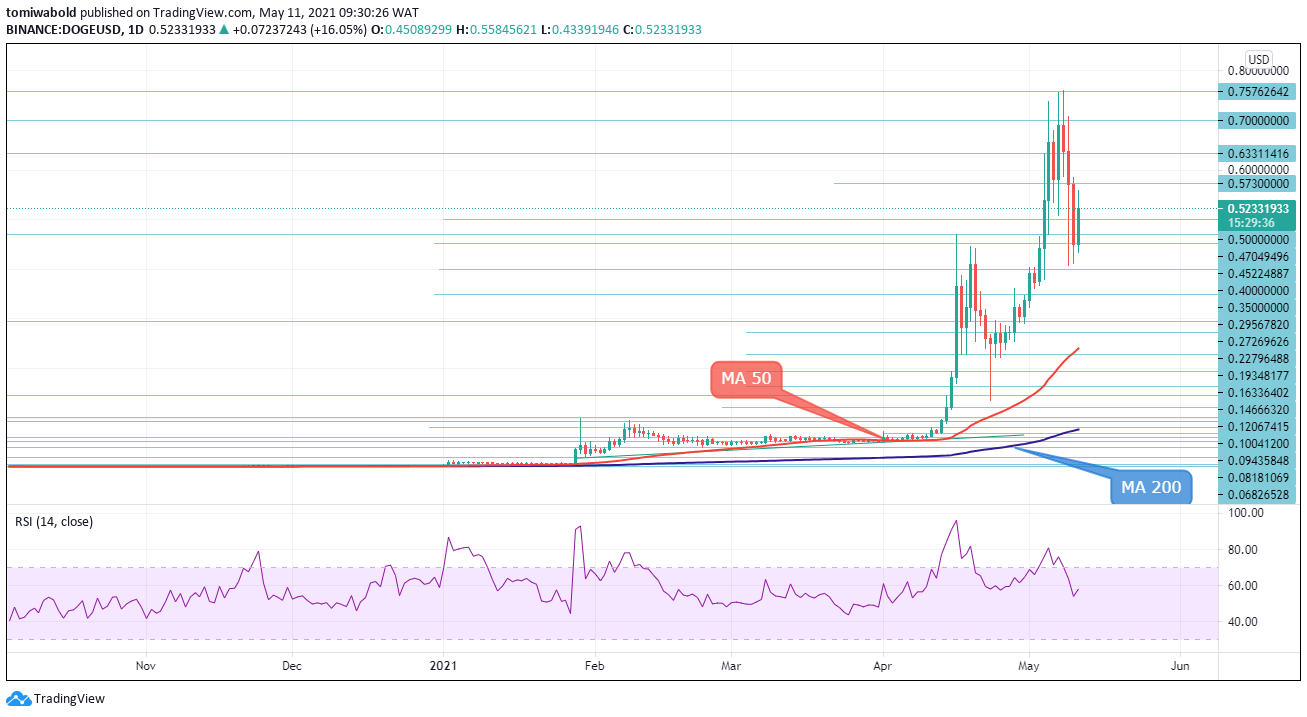
DOGE/USD Daily Chart
DOGE holds in a range on Tuesday after hitting another low at $0.4125 in the prior day, signaling that the week’s steep fall, which paused on Monday, is going to continue. DOGE/USD registered a high at $0.5846 before, closing negative for the second day of the week.
The RSI is at its 50 neutral marks and the trend seems to curtail negative momentum but continues to lose ground below the recent all-time high of $0.7604.
A brief consolidation around the $0.755 and $0.509, ended the strong upside surge, marked by a bearish daily candle with a small body and long upper and lower shadow. The support around $0.40 should be in focus if bearish action resumes as the daily technical maintain strong bearish momentum, with the formation of downward sloping relative strength index adding to a negative outlook. Alternatively, an extension higher could find immediate resistance at $0.5730 challenging.
Author

Mustapha Azeez
FX Instructor
I am a professional forex trader – signals strategist, funds manager, researcher and coach. I started my trading career some years back.


